Figures & data
Table 1 AOPPs and levels of endothelial microparticles in the plasma of healthy young subjects compared with healthy elderly subjects
Figure 1 Confirmation of the albumin oxidation.
Abbreviations: DNPH, 2,4-dinitrophenylhydrazine; DNP, 2,4-dinitrophenyl; TCA, Trichloroacetic acid; Mr, relative molecular mass; IPG, immobilized pH gradient; Ox Alb, oxidized albumin; Nat Alb, native albumin.
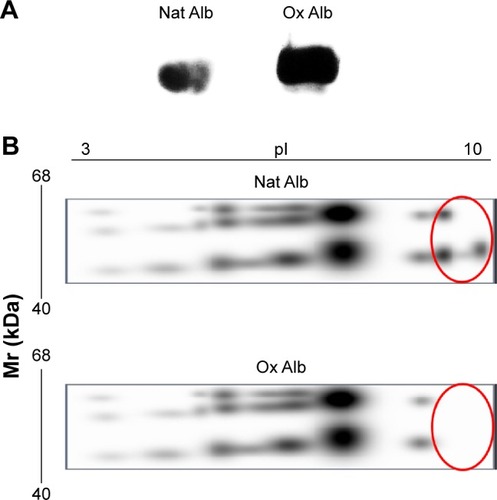
Figure 2 Flow cytometer analysis of endothelial adhesion molecules, (A) VCAM-1 and (B) ICAM-1, expression in HUVEC incubated with vehicle CuSO4 (10 µmol/L) + 0.1 mmol/L EDTA (gray bar), Nat Alb (white bars), or Ox Alb (black bars).
Abbreviations: Ox Alb, oxidized albumin; Nat Alb, native albumin; MFI, median fluorescence intensity; HUVECs, human umbilical vein endothelial cells; VCAM-1, vascular cell adhesion molecule-1; ICAM-1, intercellular adhesion molecule-1; EDTA, ethylenediaminetetraacetic acid; SD, standard deviation.
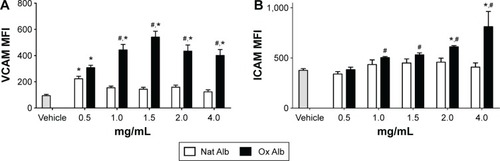
Figure 3 Flow cytometer determination of (A) cellular apoptosis and (B) endothelial microparticles expression in the supernatants of albumin-treated cells.
Abbreviations: Ox Alb, oxidized albumin; Nat Alb, native albumin; HUVEC, human umbilical vein endothelial cells; EMPs, endothelial microparticles; PI, propidium iodide; SD, standard deviation.
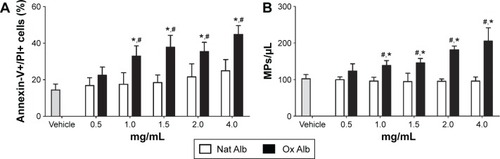
Figure 4 (A) Flow cytometer analysis of intracellular ROS production in HUVEC incubated with vehicle (white), Nat Alb (gray), or Ox Alb (black). HUVEC were treated with native and oxidized albumin (2 mg/mL) for 4 hours, (B) the histogram shows ROS as the percentage of HE-positive cells, and (C) MFI with vehicle (gray bar) and different doses of Nat Alb (white bars) and Ox Alb (black bars) for 4 hours.
Abbreviations: Ox Alb, oxidized albumin; Nat Alb, native albumin; HUVEC, human umbilical vein endothelial cells; ROS, reactive oxygen species; HE, hidroethidine; MFI, median fluorescence intensity; SD, standard deviation.
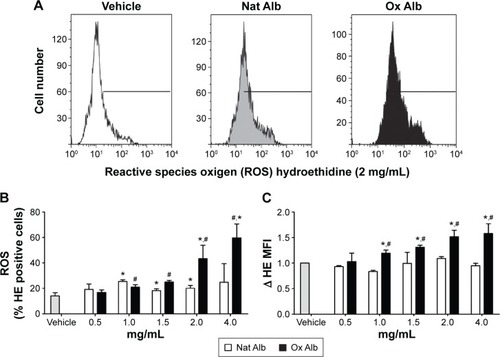
Figure 5 Senescent-associated β-galactosidase activity staining of native and oxidized albumin treatments.
Abbreviations: Ox Alb, oxidized albumin; Nat Alb, native albumin; HUVEC, human umbilical vein endothelial cells; SD, standard deviation.
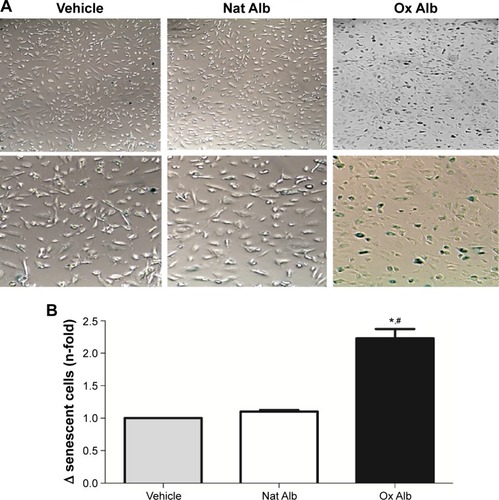
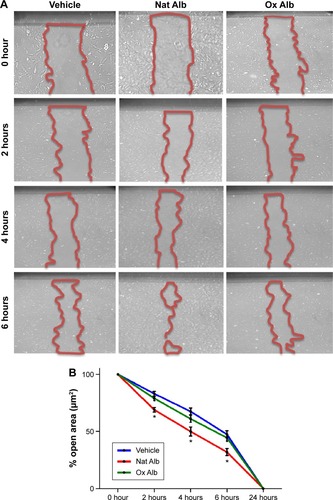
Figure 6 HUVEC with Nat Alb and Ox Alb (2 mg/mL) were scratched and wound margins were imaged from 0 up to 24 hours later.
Abbreviations: Ox Alb, oxidized albumin; Nat Alb, native albumin; HUVEC, human umbilical vein endothelial cells.