
Figures & data
Figure 1 The conceptual dynamic systems model of HRQOL showing the interactions between the physical, mental, and social domains over time (T1 … Tn).
Abbreviations: HRQOL, health-related quality of life; P, physical domain; M, mental domain; S, social domain; Rp, random factor in the physical domain; Rm, random factor in the mental domain; Rs, random factor in the social domain.
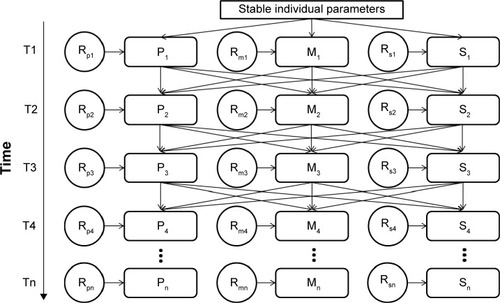
Figure 2 HRQOL developmental trajectory of subject X with low initial values in all domains.
Abbreviation: HRQOL, health-related quality of life.
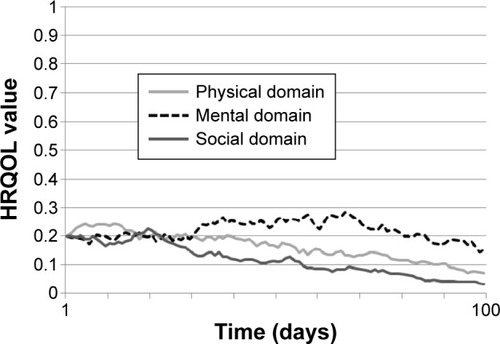
Figure 3 HRQOL developmental trajectory of subject Y with moderate initial values in all three domains.
Abbreviation: HRQOL, health-related quality of life.
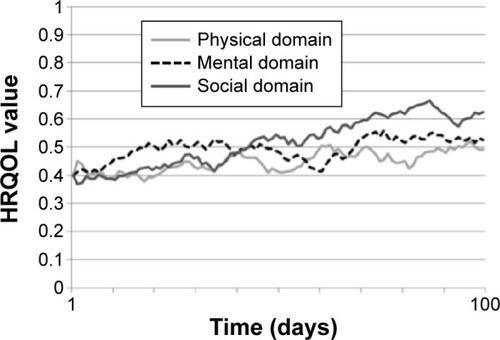
Figure 4 HRQOL developmental trajectory of the healthy and young subject Z with high initial values in all domains.
Abbreviation: HRQOL, health-related quality of life.
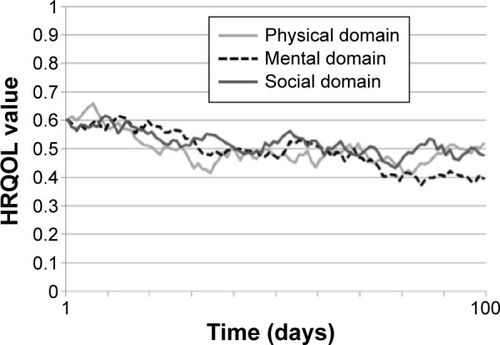
Table 1 Qualitative outcomes of the calibration procedure, analyzing trends and final results of simulated data starting from different sets of initial and parameter values
Figure 5 Extremely low developmental trajectory.
Abbreviation: HRQOL, health-related quality of life.
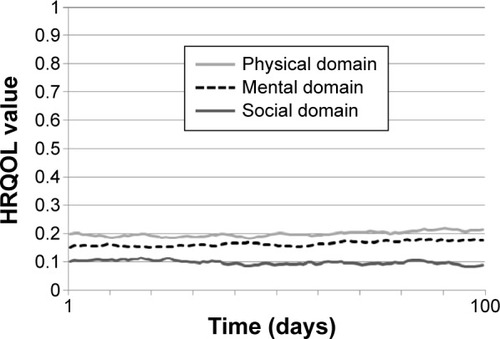
Figure 6 Extremely high developmental trajectory.
Abbreviation: HRQOL, health-related quality of life.
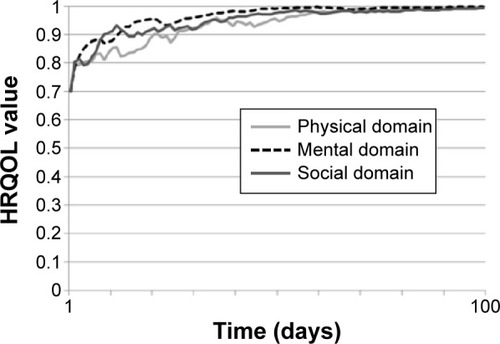
Table 2 Baseline characteristics of the participants
Table 3 Cronbach’s α analysis of indexes
Table 4 Cluster centers
Table 5 Monte Carlo analysis of the compared empirical and simulated outcomes, for different sets of initial change rates for each of the domains P, M, and S, and for the four different clusters
Table 6 Wilcoxon test for dependent samples, empirical vs simulated final data
Table 7 Mann-Whitney U pairwise comparisons of simulated and empirical final data with Dunn-Sidak corrections