Figures & data
Table 1 Study population clinical characteristics in ACS octogenarians according to homocysteine tertiles
Figure 1 Gensini score in three groups according to Hcy tertiles (<13.20 μmol/L, 13.21–18.28 μmol/L, and >18.29 μmol/L) (P=0.218).
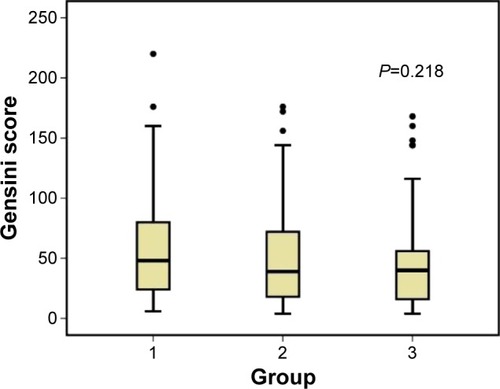
Table 2 Coronary artery characteristics and PCI treatment in ACS octogenarians
Figure 2 The all-cause mortality and MACE rates in three groups (P=0.0001, P=0.0008).
Abbreviation: MACE, major adverse cardiac events.
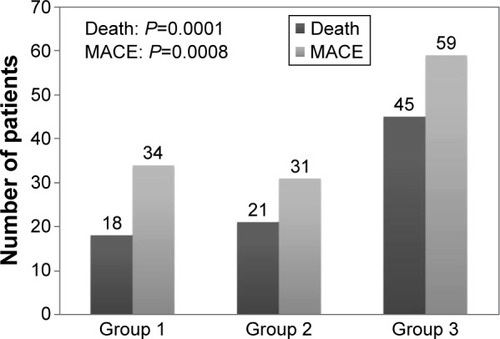
Figure 3 Kaplan–Meier survival rate curve for all-cause death according to Hcy tertiles (P=0.006).
Abbreviation: Hcy, homocysteine.
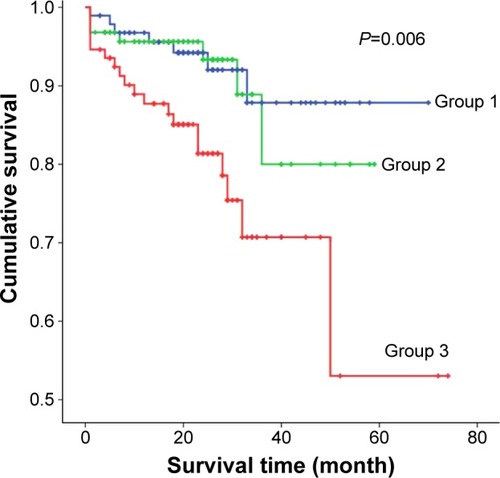
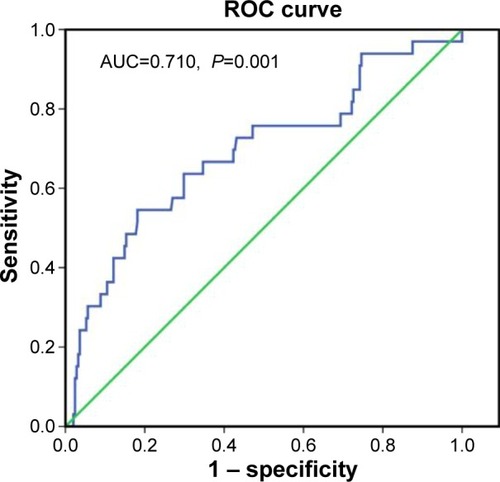
Figure 4 ROC curves for Hcy for discrimination between surviving and dead patients.
Notes: The AUC was 0.710 (P=0.001). The predictive cut-off value of Hcy for mortality was 17.67 μmol/L (sensitivity 0.667, specificity 0.681).
Abbreviations: AUC, area under the curve; Hcy, homocysteine; ROC, receiver operating characteristic.
Abbreviations: AUC, area under the curve; Hcy, homocysteine; ROC, receiver operating characteristic.