Figures & data
Table 1 Baseline characteristic of included randomized controlled trials
Figure 1 Flow diagram of trials selection.
Abbreviation: RCTs, randomized controlled trials.
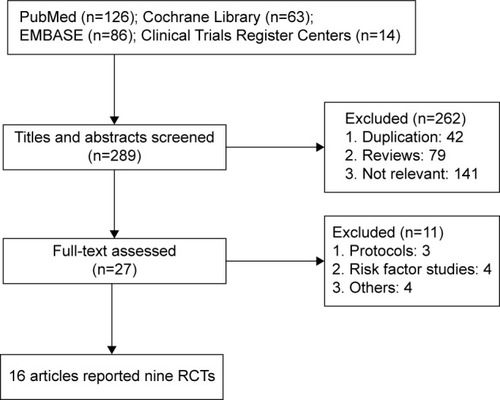
Figure 2 Summary of methodological quality assessment results.
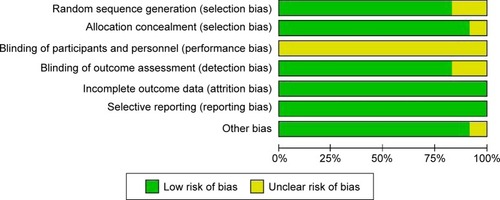
Figure 3 Meta-analysis of periprocedural and postprocedural death.
Abbreviations: M–H, Mantel–Haenszel; CI, confidence interval.
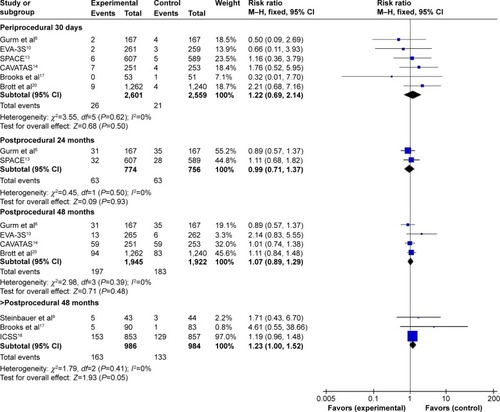
Figure 4 Meta-analysis of periprocedural and postprocedural stroke.
Abbreviations: M–H, Mantel–Haenszel; CI, confidence interval.
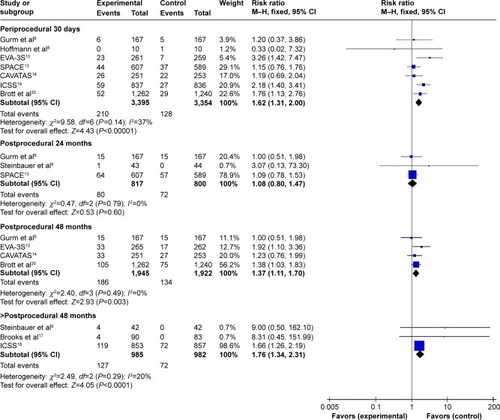
Figure 5 Meta-analysis of periprocedural and postprocedural myocardial infarction.
Abbreviations: M–H, Mantel–Haenszel; CI, confidence interval.
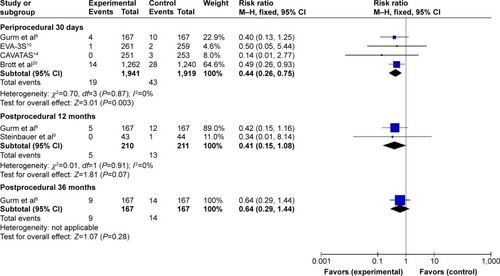
Figure 6 Meta-analysis of periprocedural disabling stroke and death.
Abbreviations: M–H, Mantel–Haenszel; CI, confidence interval.
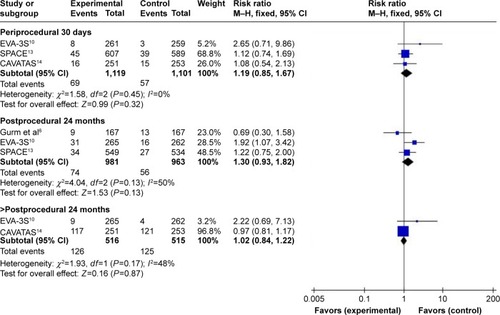
Figure 7 Meta-analysis of other periprocedural complications.
Abbreviations: M–H, Mantel–Haenszel; CI, confidence interval.
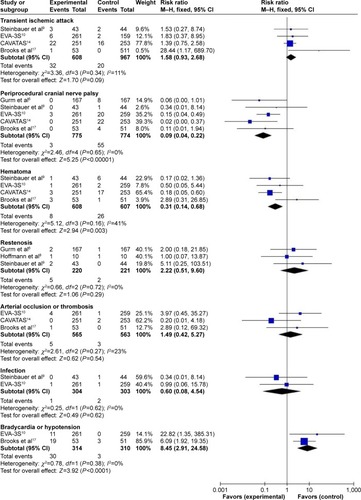
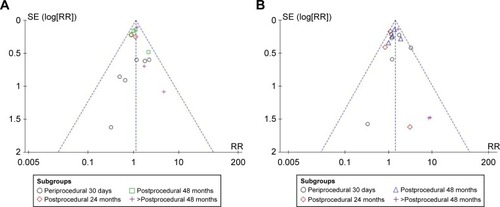
Figure 8 Inverted funnel plots indicating low risks of publication bias.
Notes: (A) Death; (B) stroke.
Abbreviations: RR, risk ratio; SE, standard error.
Abbreviations: RR, risk ratio; SE, standard error.