
Figures & data
Table 1 Description of training contents according to the FITT principles
Figure 1 Simultaneous cognitive–physical training components: video game dancing (A) and treadmill memory training (B).
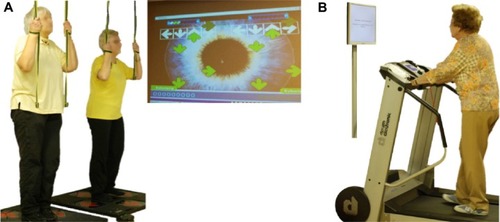
Figure 2 Examples of complementary balance (A) and strength (B) exercises.

Table 2 Baseline demographic characteristics and training compliance
Figure 3 Trial design and participants’ flow.
Abbreviations: DANCE, virtual reality video game dancing; MEMORY, treadmill walking with simultaneous verbal memory training; 6-MWT, 6-minute walk test.
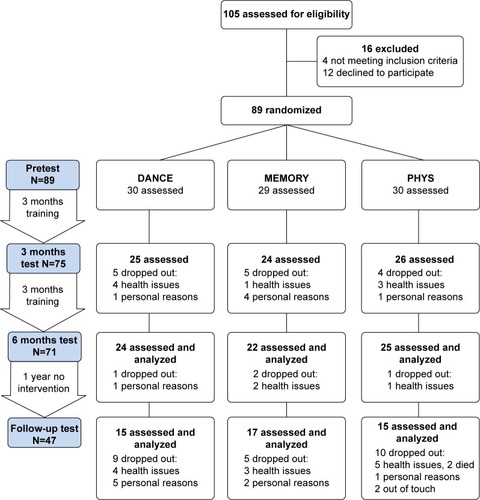
Table 3 Gait performance data
Figure 4 Development of the gait variables that showed time × intervention contrasts from pretest to 6-month test.
Abbreviations: DTC, dual-task cost; DANCE, virtual reality video game dancing; MEMORY, treadmill walking with simultaneous verbal memory training; ST, single-task; DT, dual-task; PHYS, treadmill walking.
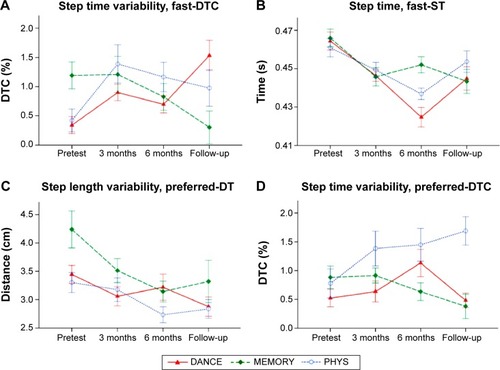
Figure 5 Development of fall frequency over 2 years.
Abbreviations: DANCE, virtual reality video game dancing; MEMORY, treadmill walking with simultaneous verbal memory training; PHYS, treadmill walking.
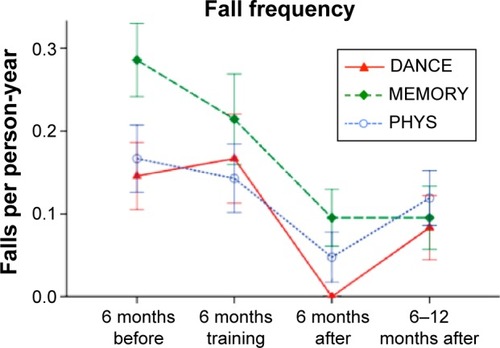
Table 4 Functional fitness, GDS, and FES-I performance data
Figure 6 Development of functional fitness.
Abbreviations: PHYS, treadmill walking; DANCE, virtual reality video game dancing; MEMORY, treadmill walking with simultaneous verbal memory training.
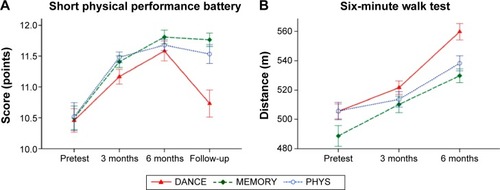
Figure 7 Performance developments for sexes.
Abbreviation: ST, single-task.
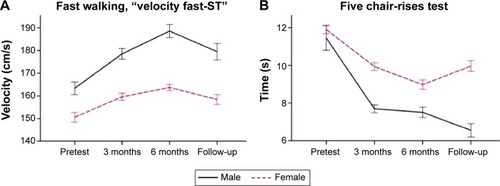
Table S1 Multiple regression for the linear global time effect (from pretest to 6-month test, N=71) and the interaction between orthogonal contrasts and time effect for gait variable “velocity”
Table S2 Multiple regression for the linear global time effect (from pretest to 6-month test, N=71) and the interaction between orthogonal contrasts and time effect for gait variable “step length”
Table S3 Multiple regression for the linear global time effect (from pretest to 6-month test, N=71) and the interaction between orthogonal contrasts and time effect for gait variable “step length variability”
Table S4 Multiple regression for the linear global time effect (from pretest to 6-month test, N=71) and the interaction between orthogonal contrasts and time effect for gait variable “step time”
Table S5 Multiple regression for the linear global time effect (from pretest to 6-month test, N=71) and the interaction between orthogonal contrasts and time effect for gait variable “step time variability”
Table S6 Repeated-measures ANOVA from 6 months to follow-up test for gait variables, N=47
Table S7 Multiple regression for the linear global time effect (from the 6-month period before training, to training, to 6 months after training, N=66) and the interaction between orthogonal contrasts and time effect for fall frequency
Table S8 Multiple regression for the linear global time effect (from pretest to 6-month test, N=71) and the interaction between orthogonal contrasts and time effect for functional fitness variables
Table S9 Repeated-measures ANOVA from 6 months to follow-up test for SPPB variables, N=47