Figures & data
Table 1 Main characteristics of participants
Figure 1 Venn diagram of the detected frail individuals by the CHS index and the TFI.
Abbreviations: CHS, Cardiovascular Health Study; TFI, Tilburg Frailty Indicator.
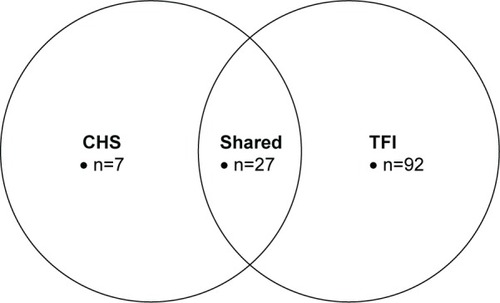
Table 2 Differences in the functional status according to frailty measures
Table 3 Relationship between uni- and multidimensional frailty measures and disability
Table 4 Criterion validity of uni- and multidimensional frailty measures for disability
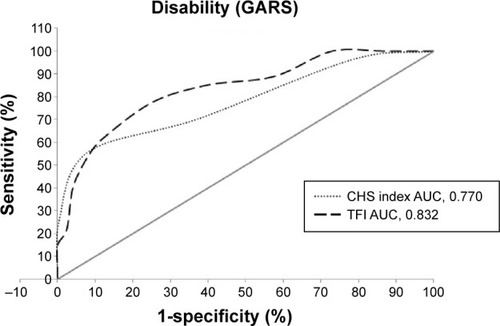
Figure 2 ROC curves for prediction of disability with CHS index and TFI.
Note: The gray diagonal line indicates a reference AUC of 0.50 (no better than chance alone).
Abbreviations: GARS, Groningen Activity Restriction Scale; CHS, Cardiovascular Health Study; AUC, areas under the curve; TFI, Tilburg Frailty Indicator; ROC, receiver operating characteristic.
Abbreviations: GARS, Groningen Activity Restriction Scale; CHS, Cardiovascular Health Study; AUC, areas under the curve; TFI, Tilburg Frailty Indicator; ROC, receiver operating characteristic.