Figures & data
Figure 1 Chromatographic fingerprint analysis and cell viability assay for the herbal formula B401.
Abbreviations: AU, arbitrary unit; IC50, half maximal inhibitory concentration; 5-HMF, 5-hydroxymethylfurfural; RA, retinoic acid; Ctrl, control group.
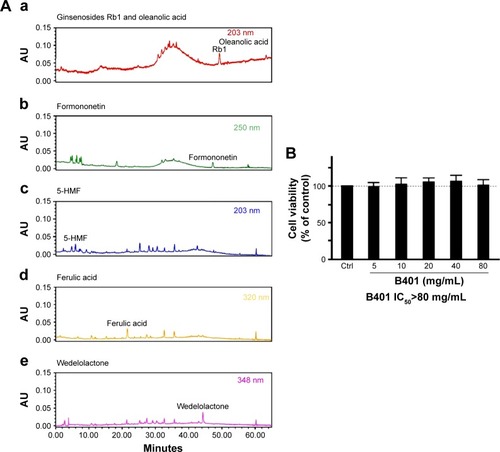
Figure 2 Oral B401 treatment prolongs life and maintains body weight of R6/2 (HD) mice.
Notes: (A) Survival duration of R6/2 mice given the oral B401 treatment was longer than those given the sham treatment. (B) Averaged body weight of R6/2 mice given the oral B401 treatment was significantly higher when compared with those given the sham treatment from 10 weeks of age and thereafter. The number of R6/2 mice under oral B401 and sham treatments were 22 and 20, respectively. Values are mean ± SEM (*P<0.05, **P<0.01, one-way ANOVA followed by a Student–Newman–Keuls multiple comparison posttest).
Abbreviations: HD, Huntington’s disease; ANOVA, analysis of variance; SEM, standard error of the mean.
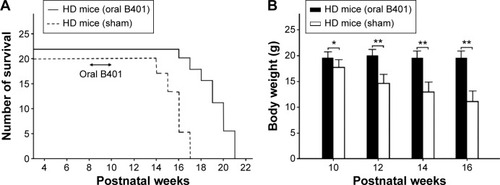
Figure 3 Oral B401 treatment enhances motor ability of R6/2 (HD) mice.
Abbreviations: HD, Huntington’s disease; ANOVA, analysis of variance; SEM, standard error of the mean.
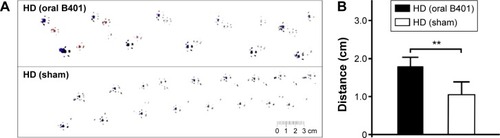
Figure 4 Huntingtin aggregations in the brain tissue of R6/2 (HD) mice were reduced under oral B401 treatment.
Abbreviations: HD, Huntington’s disease; IHC, immunohistochemistry; WT, wild-type littermate; ANOVA, analysis of variance; SEM, standard error of the mean.
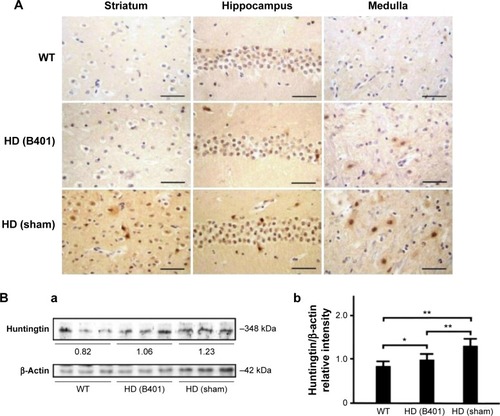
Figure 5 ROS levels in the blood of the R6/2 (HD) mice were reduced under oral B401 treatment.
Notes: (A) Chemiluminescence analysis shows that the expressions of ROS in the blood of the 10-week-old R6/2 mice given the oral B401 treatment were obviously weaker than those given the sham treatment but were obviously more intense than their WT. (B) The quantified expression blood levels of ROS in the 10-week-old R6/2 mice given the oral B401 treatment were significantly lower than those mice given the sham treatment. The number of R6/2 mice under oral B401 and sham treatments was six for each group. Values are mean ± SEM (**P<0.01, one-way ANOVA followed by a Student–Newman–Keuls multiple comparison posttest).
Abbreviations: ECL, electro-chemiluminescence; HD, Huntington’s disease; ROS, reactive oxygen species; WT, wild-type littermate; ANOVA, analysis of variance; SEM, standard error of the mean.
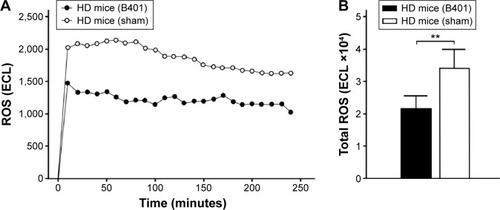
Figure 6 Expressions of anti-oxidative stress-related SOD2 in the brain tissue of the R6/2 (HD) mice were enhanced under oral B401 treatment.
Abbreviations: HD, Huntington’s disease; IHC, immunohistochemistry; SOD2, superoxide dismutase 2; WT, wild-type littermate; ANOVA, analysis of variance; SEM, standard error of the mean.
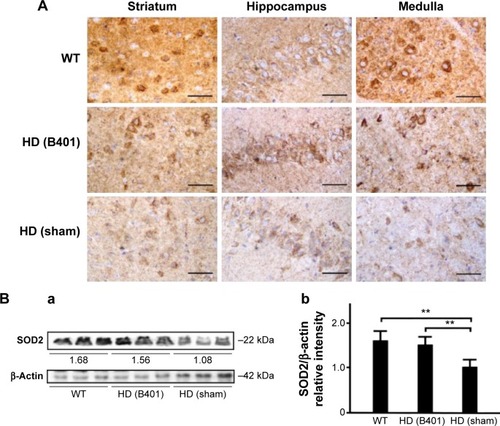
Figure 7 Expressions of ER-stress-related calpain in the brain tissue of the R6/2 (HD) mice were reduced under oral B401 treatment.
Notes: (A) IHC staining shows that the expressions of calpain in the striatum, hippocampus, and medulla of the 10-week-old R6/2 mice given the oral B401 treatment were obviously weaker than those given the sham treatment but had shown no difference in their WT. Scale bars: 30 µm. Western blotting analysis shows the following: (Ba) expression levels of calpain in whole brain tissue of the 10-week-old R6/2 mice given both oral B401 and sham treatments, and their WT and (Bb) quantified brain calpain levels of the 10-week-old R6/2 mice were significantly higher than their WT and significantly lower under oral B401 treatment. The number of R6/2 mice under oral B401 and sham treatments, and their WT was six for each group. Values are mean ± SEM (**P<0.01, two-way ANOVA followed by a Student–Newman–Keuls multiple comparison posttest).
Abbreviations: ER, endoplasmic reticulum; HD, Huntington’s disease; IHC, immunohistochemistry; WT, wild-type littermate; ANOVA, analysis of variance; SEM, standard error of the mean.
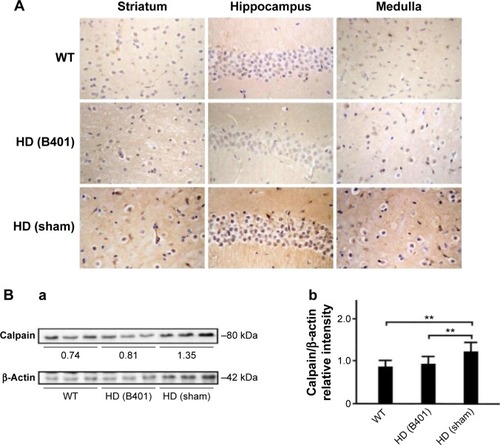
Figure 8 The ratio of anti-apoptosis-related Bcl-2/Bax in the brain tissue of the R6/2 (HD) mice was increased under oral B401 treatment.
Notes: IHC staining shows that (Aa) the expressions of Bcl-2 were in the striatum, hippocampus, and medulla of the 10-week-old R6/2 mice given the oral B401 treatment were obviously greater than those given the sham treatment, but (Ab) the expressions of Bax were obviously weaker than those given the sham treatment. Western blotting analysis shows the following: (Ba) expression levels of Bcl-2 and Bax in whole brain tissue of the 10-week-old R6/2 mice given both oral B401 and sham treatments, and their WT and (Bb) the quantified brain ratio of Bcl-2/Bax in the 10-week-old R6/2 mice was significantly lower than their WT and significantly higher under oral B401 treatment. The number of R6/2 mice under oral B401 and sham treatments and their WT was six for each group. Values are mean ± SEM (*P<0.05, **P<0.01, two-way ANOVA followed by a Student–Newman–Keuls multiple comparison posttest).
Abbreviations: Bax, Bcl-2-associated X protein; Bcl-2, B-cell lymphoma 2; HD, Huntington’s disease; IHC, immunohistochemistry; WT, wild-type littermate; ANOVA, analysis of variance; SEM, standard error of the mean.
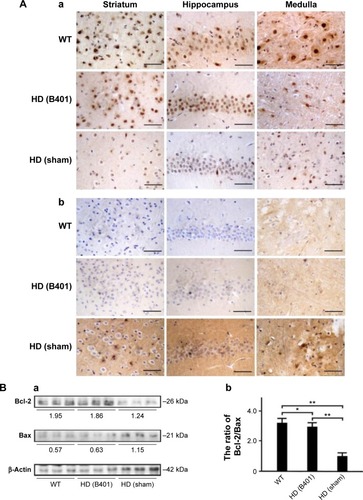
Figure 9 Expressions of apoptosis-related caspase 3 in the brain tissue of R6/2 (HD) mice were reduced under oral B401 treatment.
Abbreviations: HD, Huntington’s disease; IHC, immunohistochemistry; WT, wild-type littermate; ANOVA, analysis of variance; SEM, standard error of the mean.
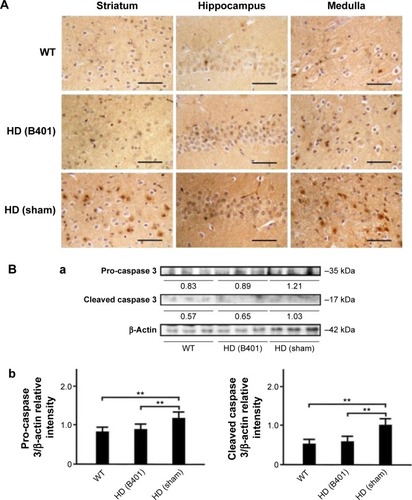
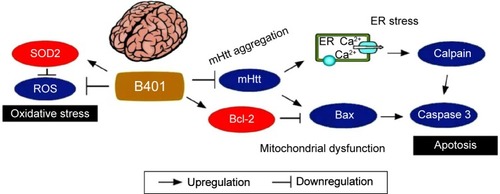
Figure 10 The schematic diagram illustrates the possible neuroprotective pathways in the brain under oral B401 treatment. Oral B401 treatment may improve neuroprotection in R6/2 mice via enhancing anti-oxidative stress (marked by SOD2) and anti-apoptosis (marked by Bcl-2), while suppressing mutant huntingtin aggregation, ROS production, ER stress-related apoptosis (marked by calpain), and mitochondrial dysfunction-related apoptosis (marked by Bax and caspase 3) in the brain.