Figures & data
Figure 1 The differences in central retinal thickness (CRT) over time in treated and untreated contralateral eyes.
Note: Data presented as mean with 95% CI, P<0.05, ANOVA for repeated measures.
Abbreviations: CI, confidence interval; ANOVA, analysis of variance.
Abbreviations: CI, confidence interval; ANOVA, analysis of variance.
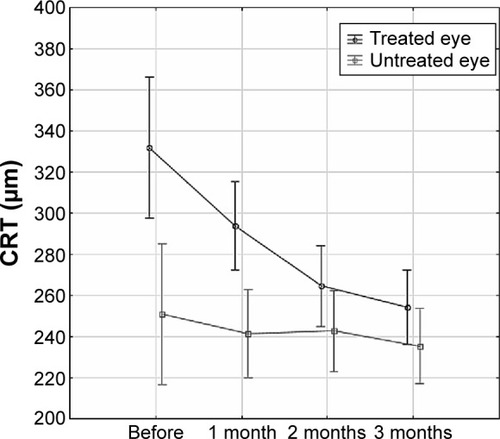
Figure 2 The central retinal thickness (CRT) measured by optical coherence tomography before the first dose of treatment and 3 months after the initiation of treatment in treated and untreated contralateral eyes.
Notes: (A) Treated and (B) untreated contralateral eyes. Box and whisker plots present mean ± SE and SD of central retinal thickness; *P<0.05, paired t-test.
Abbreviations: SE, standard error; SD, standard deviation.
Abbreviations: SE, standard error; SD, standard deviation.
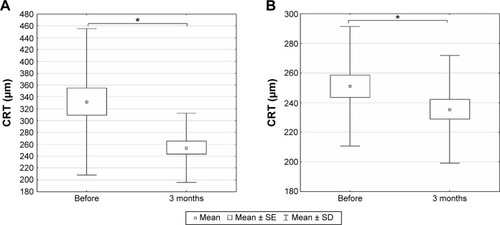
Table 1 Changes in gene expression in PBMCs of AMD patients before and after ranibizumab treatment
Table 2 PANTHER classification of biological processes, molecular functions, and cellular components significantly enriched in the set of differentially expressed genes
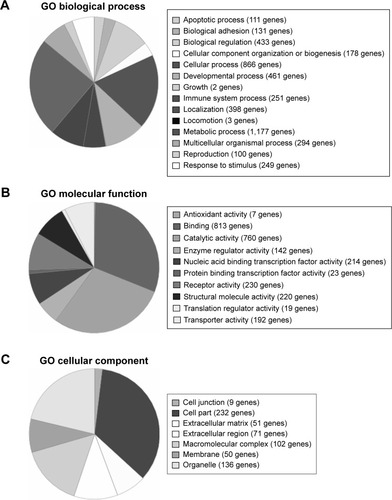
Figure 3 PANTHER classification of differentially expressed genes.
Notes: Based on biological processes (A), molecular functions (B), and cellular components (C).
Abbreviations: PANTHER, Protein Analysis Through Evolutionary Relationships; GO, gene ontology.
Abbreviations: PANTHER, Protein Analysis Through Evolutionary Relationships; GO, gene ontology.