
Figures & data
Table 1 Goal attainment scaling formula and sample of goal setting
Table 2 Participant baseline characteristics (n=55)
Figure 1 Types and number of goals met or unmet.
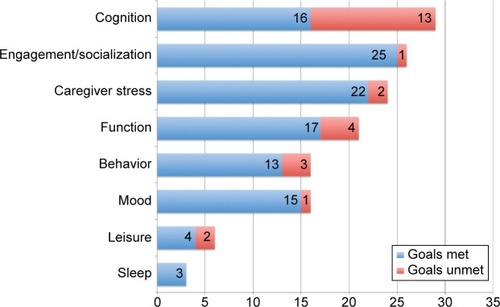
Table 3 Comparison of scores pre- and postintervention, with effect size estimates for each measure
Table 4 Spearman correlation coefficients for change scores and GAS scores