Figures & data
Figure 1 Consort flowchart.
Note: Chart shows screening and randomization, as well as the number of people completing each 4-week phase of the 20-week study on Puer tea extract.
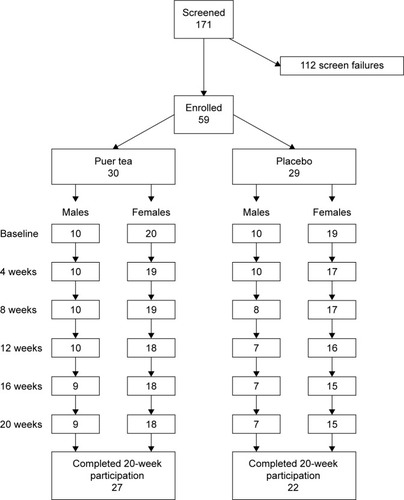
Table 1 Characteristics of study population
Figure 2 Body mass index (BMI).
Notes: Shown as the group averages ± standard error of mean for the Puer tea extract (PTE) group (solid lines) and the placebo group (dashed lines). There was a significant difference in BMI between the two groups at week 20. The BMI reduction within the PTE group over the course of the 20-week study was highly significant. *P<0.05, ##P<0.01.
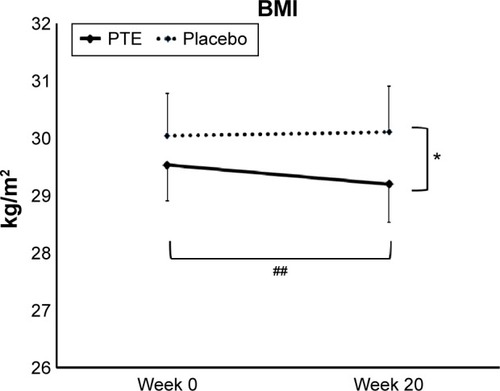
Figure 3 Changes in total body fat and regional fat composition.
Notes: Shown as the group averages of the individual percentage changes ± standard error of mean for the Puer tea extract (PTE) group (solid lines) and the placebo group (dashed lines). There were no significant differences between the two groups at week 20; however, the between-group difference in fat loss in the arms showed a statistical trend. Within the group consuming PTE, a significant loss of total body fat was seen. The total fat loss was associated with regional fat loss in the trunk, arms, thighs, and gynoid (belly/hip) regions. The fat loss in the gynoid region within the PTE group was statistically significant. *P<0.1, #P<0.05.
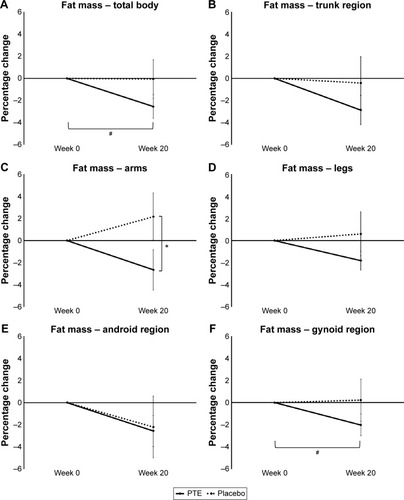
Figure 4 Lipid data are shown as group averages ± standard error of mean for the Puer tea extract (PTE) group (solid lines) and the placebo group (dashed lines).
Notes: There were no significant differences between the PTE and placebo results for cholesterol (A), HDL (B), or LDL (C). Within the PTE group, a significant reduction in cholesterol levels was seen already at week 4, and remained statistically significantly lower than baseline throughout the study. Triglyceride levels showed a reduction in the PTE group that was not statistically significant, but was clinically important (D): the group average in the PTE group went down into the normal range (below 150 mg/dL) after 8 weeks, and remained low throughout the remainder of the study. After 20 weeks, there was a 20% reduction in the average triglyceride levels within the PTE group (P<0.08).
Abbreviations: HDL, high-density lipoprotein; LDL, low-density lipoprotein.
Abbreviations: HDL, high-density lipoprotein; LDL, low-density lipoprotein.
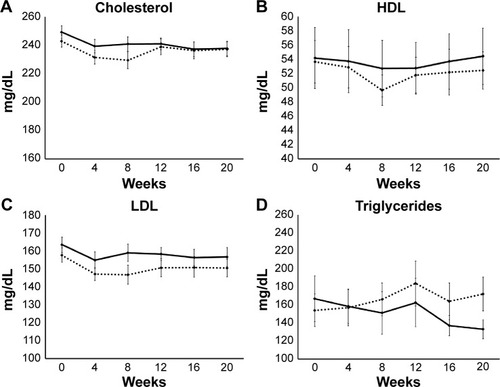
Table 2 Systolic and diastolic blood pressure during the study
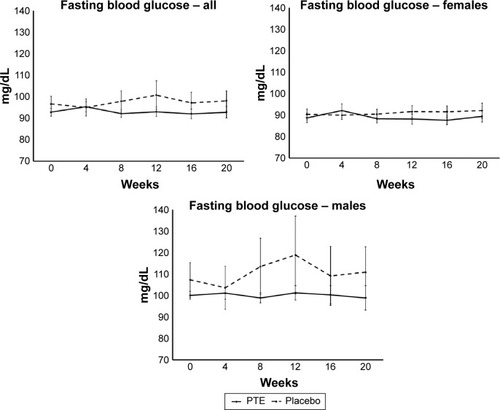
Figure 5 Fasting blood glucose levels.
Notes: Shown as group averages ± standard error of mean for the Puer tea extract (PTE) group (solid lines) and the placebo group (dashed lines). There were no significant differences between the PTE and placebo results during the study; however, the fasting blood glucose levels remained lower in the PTE group than the placebo group from week 8 throughout the remainder of the 20-week study.