Figures & data
Table 1 Patients’ sociodemographic and clinical characteristics
Table 2 QoL evaluation using the MacNew questionnaire in each domain: global, physical, emotional, and social
Table 3 FS evaluation in each domain: global, physical, psychological, and social
Table 4 Spearman’s rank correlation coefficients (rS) for MacNew questionnaire domains and TFI domains
Figure 1 Diagram of correlations between MacNew global QoL scores and TFI global FS scores.
Abbreviations: FS, frailty syndrome; QoL, quality of life; FS, frailty syndrome; TFI, Tilburg frailty indicator.
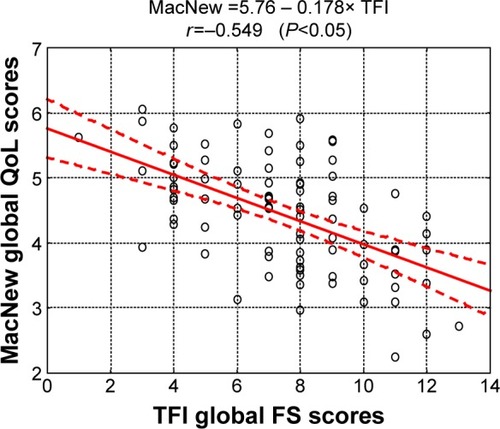
Table 5 Influence of demographic characteristics, clinical factors and comorbidities on global MacNew QoL scores
Table 6 QoL models
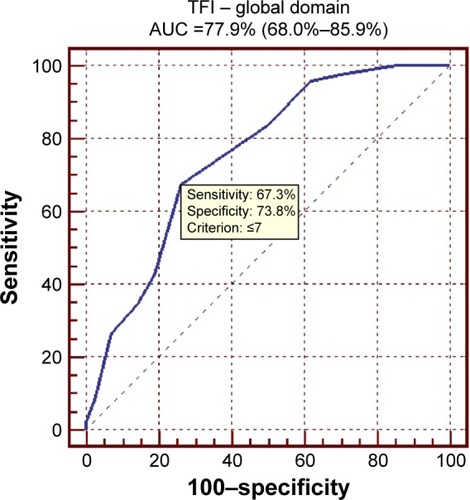
Figure 2 ROC curve for the global TFI score (cutoff value: TFI ≤7).
Abbreviations: ROC, receiver operating characteristic; TFI, Tilburg frailty indicator; AUC, area under ROC curve.