
Figures & data
Figure 1 Plots showing the estimated statin therapy initiation rates from 1995 to 2013.
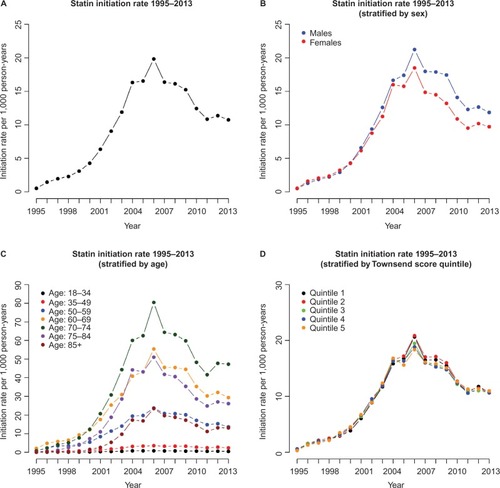
Table 1 Demographics of the cohort for the initiation of statin therapy study
Table 2 Table showing statin therapy initiation rates for all patients and for males and females separately from 1995 to 2013 per 1,000 person-years
Table 3 Results from univariable and multivariable analyses, estimating the relative statin therapy initiation rates, adjusted for time, with regard to sex, age group, and Townsend score quintile
Table 4 Demographics of the cohort for the prevalence of statin therapy study
Figure 2 Plots showing the estimated statin prescription prevalence rates from 1995 to 2013.
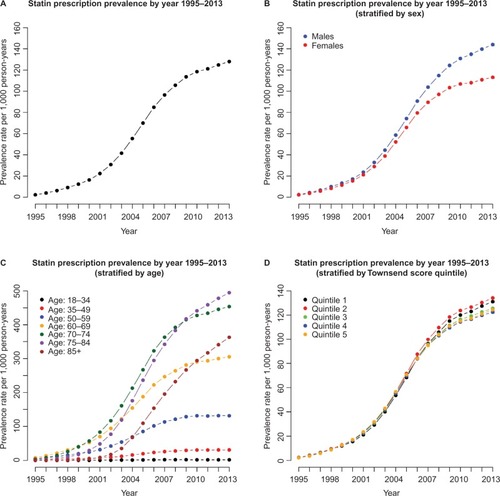
Table 5 Table showing statin prescription prevalence rates for all patients and for males and females separately from 1995 to 2013 (per 1,000 person-years)