
Figures & data
Table 1 Baseline characteristics of OHCA and IHCA patients treated with targeted temperature management
Table 2 Logistic regression analysis of variables associated with survival to hospital discharge in OHCA and IHCA patients treated with targeted temperature management
Figure 1 Kaplan–Meier curves illustrating cumulative long-term survival in OHCA and IHCA patients treated with targeted temperature management.
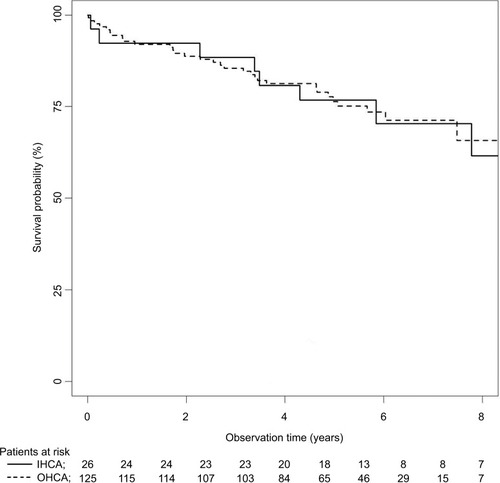
Table 3 Baseline characteristics of OHCA and IHCA patients treated with targeted temperature management who survived to hospital discharge
Table 4 Univariate and multivariate Cox regression analysis of factors associated with long-term survival after hospital discharge in OHCA and IHCA patients treated with targeted temperature management