Figures & data
Figure 1 Relative frequency of primary admission conditions according to major ICD-10 groups (corresponding disease categories are shown in ).
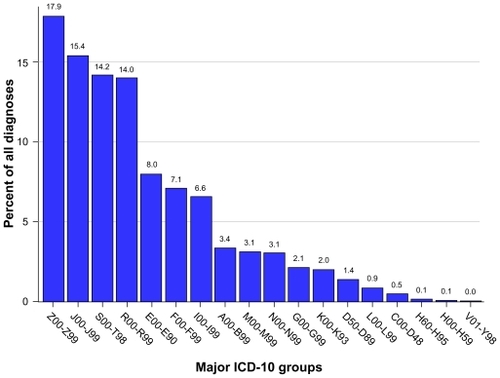
Table 1 Characteristics of patients with a first-ever admission to the medical admission unit at Aarhus University Hospital, Nørrebrogade, during 2008
Table 2 Frequency and proportion of primary admission conditions according to major ICD-10 groups
Figure 2 Mortality for all patients.
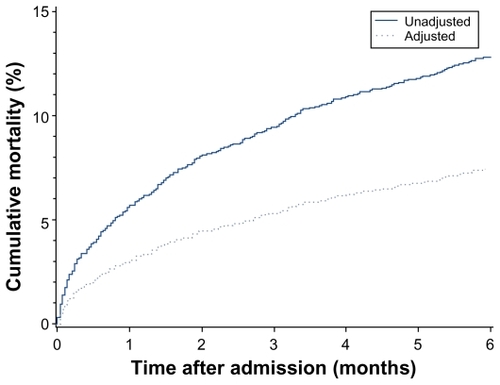
Figure 3 Mortality according to gender. A) Unadjusted; B) adjusted.
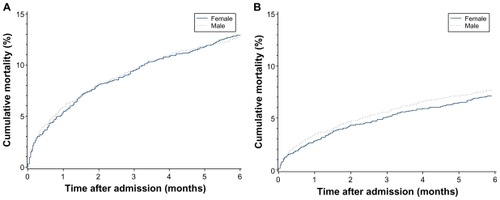
Figure 4 Mortality according to age groups. A) Unadjusted; B) adjusted.
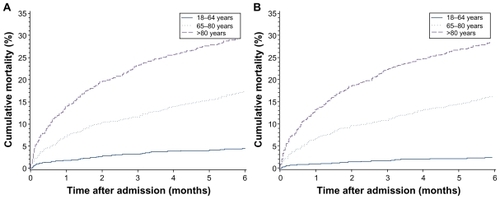
Figure 5 Mortality according to comorbidity level. A) Unadjusted; B) adjusted.
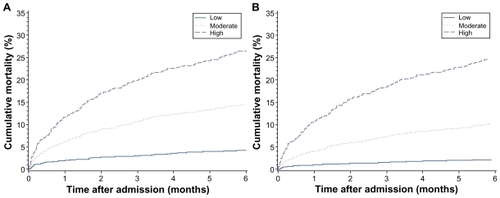
Table 3 Cumulative mortality risk after 1, 3, and 6 months, overall and according to gender, age, and comorbidity groups
Table 4 Mortality hazard ratios within gender, age, and comorbidity groups
Table 5 Mortality hazard ratios stratified on gender, age, and comorbidity groups