Figures & data
Figure 1 Propensity score over time for GLP-1 versus basal insulin initiators.
Notes: Blue: GLP-1, red: insulin.
Abbreviation: GLP-1, glucagon-like peptide-1 analogs.
Abbreviation: GLP-1, glucagon-like peptide-1 analogs.
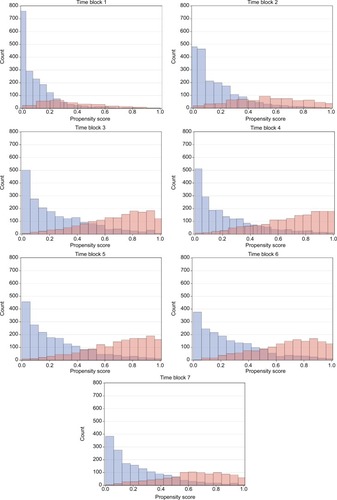
Figure 2 Propensity score over time for DPP-4i versus sulfonylurea initiators.
Notes: Blue: DPP-4i, red: insulin.
Abbreviation: DPP-4i, dipeptidyl peptidase-4 inhibitors.
Abbreviation: DPP-4i, dipeptidyl peptidase-4 inhibitors.
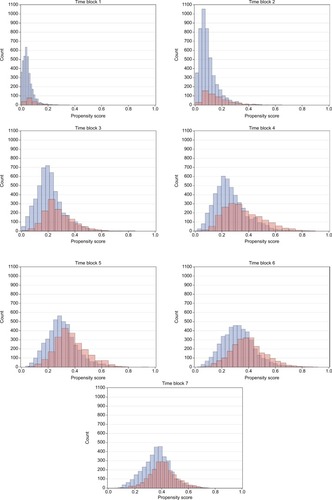
Figure 3 Relative mean difference in change in HbA1C and weight (95% CI), GLP-1 (reference group) versus basal insulin initiator in the PP cohort adjusted for baseline HbA1c and weight, respectively.
Notes: Gray: crude analyses, black: propensity score-matched patients. (A) HbA1c. (B) weight.
Abbreviations: CI, confidence interval; GLP-1, glucagon-like peptide 1 analogs; HbA1c, glycated hemoglobin; PP, per-protocol.
Abbreviations: CI, confidence interval; GLP-1, glucagon-like peptide 1 analogs; HbA1c, glycated hemoglobin; PP, per-protocol.
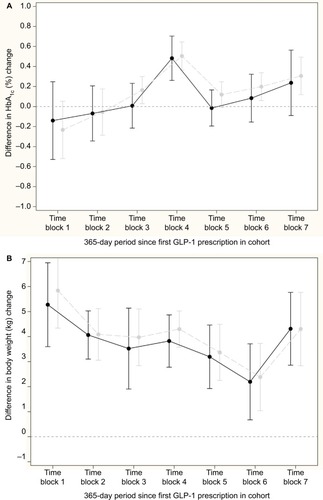
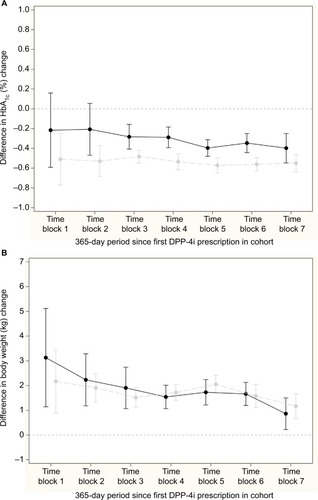
Figure 4 Relative mean difference in change in HbA1C and weight (95% CI), DPP-4i (reference group) versus sulfonylurea initiator in the PP cohort adjusted for baseline HbA1c and weight, respectively.
Notes: Gray: crude analyses, black: propensity score-matched patients. (A) HbA1c. (B) weight.
Abbreviations: CI, confidence interval; DPP-4i, dipeptidyl peptidase-4 inhibitors; HbA1c, glycated hemoglobin; PP, per-protocol.
Abbreviations: CI, confidence interval; DPP-4i, dipeptidyl peptidase-4 inhibitors; HbA1c, glycated hemoglobin; PP, per-protocol.