
Figures & data
Figure 1 Lead time based on moment of referral and time of dialysis initiation.
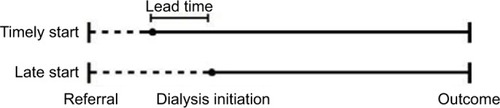
Figure 2 Patient-inclusion flowchart for patients with data on mGFR (A) and data on eGFR (B).
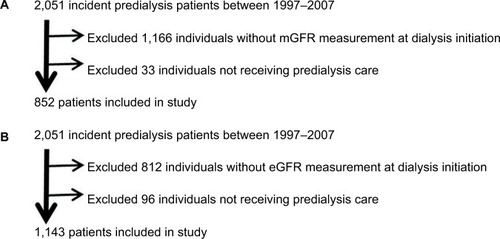
Table 1 Patient characteristics
Figure 3 Kaplan–Meier survival curves for late, intermediate, and early starters.
Abbreviations: mGFR, measured glomerular filtration rate; eGFR, estimated glomerular filtration rate.
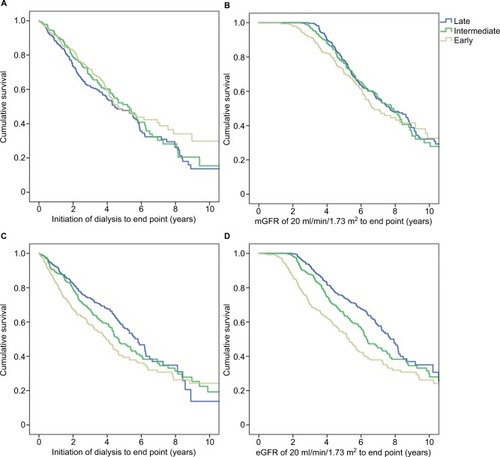
Table 2 Effect of GFR at dialysis initiation on survival and length of lead time
Table 3 Effect of GFR at dialysis initiation on survival and length of lead time
Table 4 Rates of kidney function decline in PREPARE-1
Table 5 Rates of kidney function decline in NECOSAD
Table 6 Effect of GFR at dialysis initiation on survival and length of lead time based on literature search
Table S1 Annual rates of kidney function decline prior to dialysis initiation for late, intermediate, and early starters with available data in PREPARE-1 and NECOSAD
Table S2 Effect of GFR at dialysis initiation on survival and length of lead time