
Figures & data
Figure 1 Mean (95% CI) heavy drinking days per week by topiramate (green circle) or placebo (red square) intervention group.
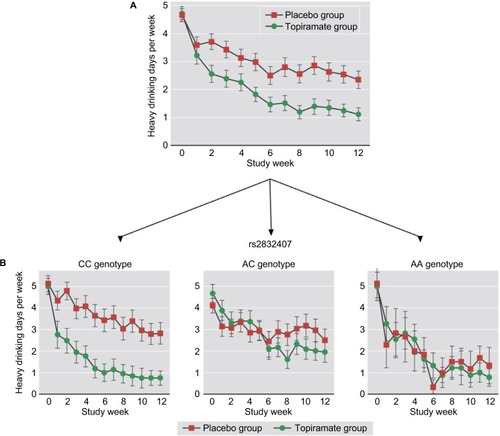
Table 1 Relative risk of endometrial cancer in postmenopausal women continuously using combined hormone replacement therapy (HRT), and the effect modification by body mass index (BMI)
Table 2 Incidence rate of ischemic heart disease after the use of single or combined antithrombotic therapy with low-dose aspirin and warfarin
Table 3 Use of single and combined antithrombotic therapy and risk of serious upper gastrointestinal bleeding in a case–control study using research databases in Denmark, 2000–2004
Figure 2 Relation between the exposure – the intermediate or mediator – and the outcome.
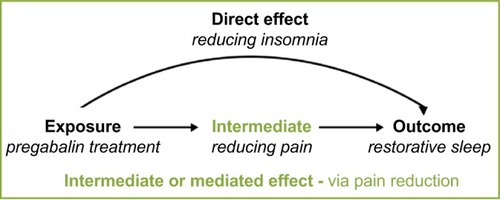
Table 4 Total effect of fibromyalgia treatment (pregabalin vs placebo) on restorative sleep improvement (measured using the Sleep Quality Daily Diary score), and indirect effect via pain scale reduction
Table 5 Total effect of blood group (non-O vs O) on the occurrence of deep venous thrombosis, and the direct effect of blood group on the occurrence of deep venous thrombosis, from the case–control Leiden Thrombophilia study