
Figures & data
Table 1 An example of a situation when data are MAR rather than MCAR
Table 2 Proposed methods for dealing with missing data in the analytic phase
Figure 1 Distribution of BMI values by outcome in full dataset (A) and in a dataset with 35% missing values (B) for BMI handled by creating a missing BMI category.
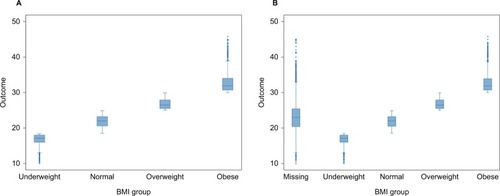
Figure 2 Normal distribution of observed BMI in a full dataset of 10,000 observations.
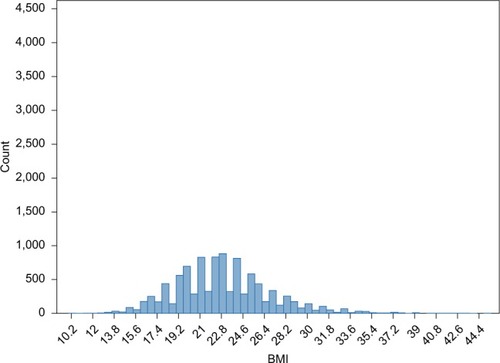
Figure 3 Distribution of BMI in a dataset of 10,000 observations, where 35% of BMI values are missing and replaced by the observed mean BMI value.
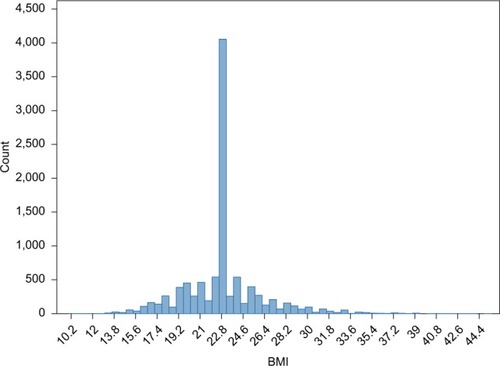
Figure 4 Selection of variables in order to create multiple imputed datasets when looking into the association between body mass index and transfusion risk.
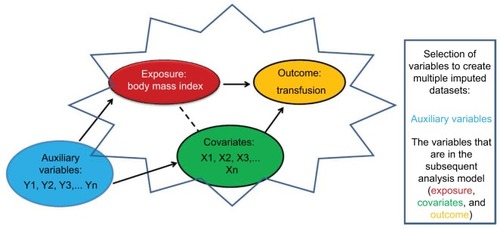
Figure 5 The three main stages of implementing multiple imputation.
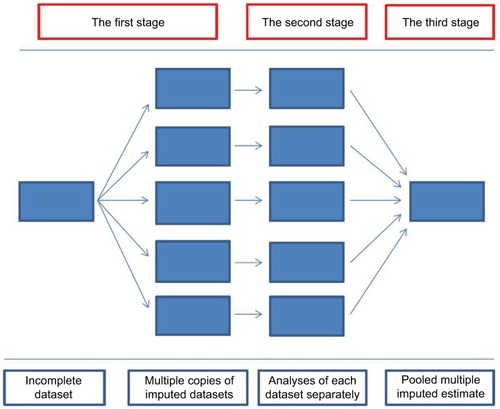
Table 3 An example of the imputed missing BMI values generated with five imputed datasets
Table 4 Association between BMI and risk of blood transfusion adjusted for age and gender