Figures & data
Table 1 Different types of confounders and potential solutions on how to control for these in observational studies based on health care databases
Table 2 Examples of instrumental variables recently used in published studies
Figure 1 First CD4 count and mortality hazard rate in an HIV-positive population.
Notes: Predicted hazards are displayed as solid lines. Dashed line shows extrapolated prediction if all patients were treatment eligible at first CD4 count. Dots are hazards predicted for CD4 count bins of width 10 cells. Copyright © 2014 by Lippincott Williams & Wilkins. Figure originally published by Bor et al. Regression discontinuity designs in epidemiology: causal inference without randomized trials. Epidemiology 2014;25:729–737.Citation46
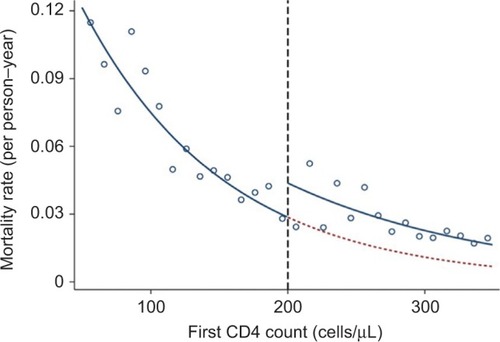
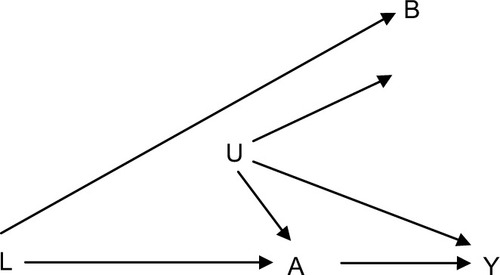
Figure 2 Causal diagram showing an ideal negative control exposure B for use in evaluating studies of the causal relationship between exposure A and outcome Y.
Notes: B should ideally have the same incoming arrows as A. U is the set of uncontrolled confounders. L is assumed measured and controlled for. Modified with permission from Lipsitch et al. Negative controls: a tool for detecting confounding and bias in observational studies.in Epidemiology 2010;21(3):383–388. https://www.ncbi.nlm.nih.gov/pubmed/20335814.Citation49