
Figures & data
Table 1 Characteristics of intensive care patients included in the study (n=959) according to complete or incomplete scores
Figure 1 Scatter plot of CCI scores according to source of deriving the score, either from register or chart review.
Abbreviation: CCI, Charlson comorbidity index.
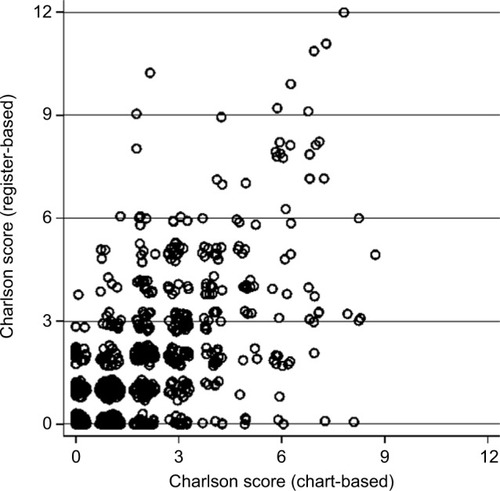
Table 2 Spearman’s rank correlations between different variations of Charlson comorbidity scores (n=959)
Table 3 Cross-tabulation of categorized Charlson index from the 2 sources
Table 4 Prevalence, agreement, and positive predictive value for Charlson score from administrative and chart data (n=959)
Table 5 Discrimination for the risk-adjustment models according to included variables, using c-statistics (area under the ROC curve) with 95% CI for 30-day and 1-year mortality
Table 6 Model calibration for various combinations of covariates