Figures & data
Figure 1 STARD diagram showing the selection of study participants enrolled in the BLITZ study during 2005–2015 and the analysis scheme.
Abbreviations: CRC, colorectal cancer; STARD, STAandards for the Reporting of Diagnostic accuracy studies.
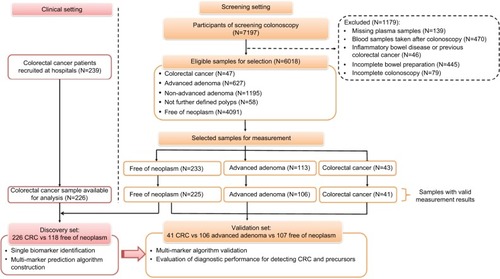
Table 1 Characteristics of the study population in the discovery set and validation set
Table 2 Diagnostic performance of 12 significant protein markers
Figure 2 Comparison of ROC curves of the four- and five-marker panel for detecting: (A) CRC vs controls free of neoplasm; (B) advanced adenomas vs controls free of neoplasm.
Abbreviations: AUC, area under the curve; CRC, colorectal cancer; ROC, receiver operating characteristic.
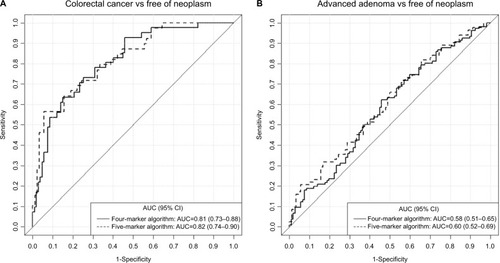
Table 3 Diagnostic performance of multi-marker panels for detecting CRC in the validation set
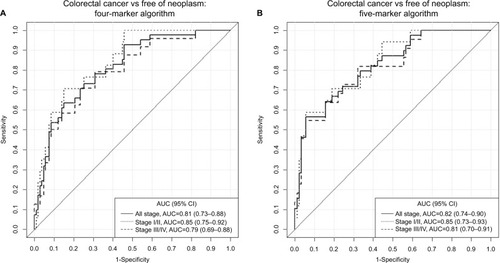
Figure 3 Comparison of ROC curves of (A) the four-marker panel and (B) five-marker panel for detecting early- and late-stage CRCs.
Abbreviations: AUC, area under the curve; CRC, colorectal cancer; ROC, receiver operating characteristic.