
Figures & data
Table 1 Baseline characteristics of the overall NAFLD cohort and by diabetes status
Table 2 Baseline liver function scores of the overall NAFLD cohort and by diabetes status
Table 3 Disease severity of overall NAFLD cohort and by diabetes status at the index dateTable Footnotea
Figure 1 Time to disease progression among patients,a stratified by diabetes status.
Notes:
aIncludes patients with index stage of uncomplicated NAFLD, advanced fibrosis, cirrhosis, or hepatocellular carcinoma; patients with an index stage of liver transplant were excluded from progression analyses.
Abbreviations: NAFLD, nonalcoholic fatty liver disease; SD, standard deviation.
Abbreviations: NAFLD, nonalcoholic fatty liver disease; SD, standard deviation.
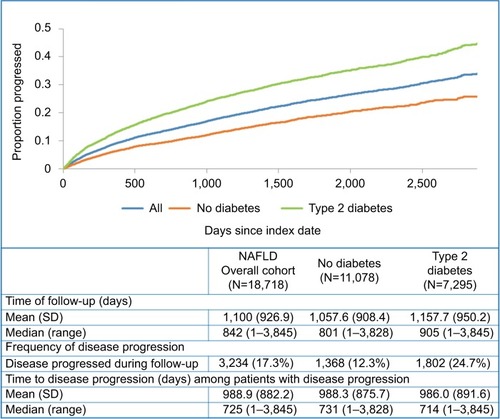
Figure 2 Transition rates of disease progression within one year, derived from multistate model.
Notes: Arrows indicate progression from one disease stage to another. Colored circles indicate different disease stages over the NAFLD disease course, and colored arrows indicate progression to the corresponding disease stage.
Abbreviations: HCC, hepatocellular carcinoma; NAFLD, nonalcoholic fatty liver disease.
Abbreviations: HCC, hepatocellular carcinoma; NAFLD, nonalcoholic fatty liver disease.
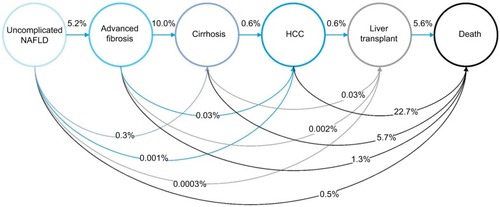
Table S1 Study sample attrition