
Figures & data
Table 1 Selected characteristics of the study population, imputed data
Table 2 Distribution of potential confounders according to FH among controls, imputed data
Table 3 Risk of CRC according to GRS and FH of CRC
Figure 1 Risk of CRC according to GRS percentiles.
Abbreviations: CRC, colorectal cancer; GRS, genetic risk score; OR, odds ratio.
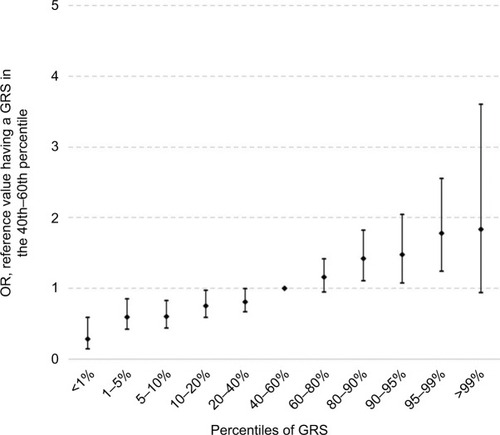
Figure 2 Dose–response association between the number of risk alleles and risk of CRC, stratified by FH, plotted with a joint reference (no FH, 35 risk alleles).
Abbreviations: CRC, colorectal cancer; FDR, first-degree relative; FH, family history; OR, odds ratio; SDR, second-degree relative.
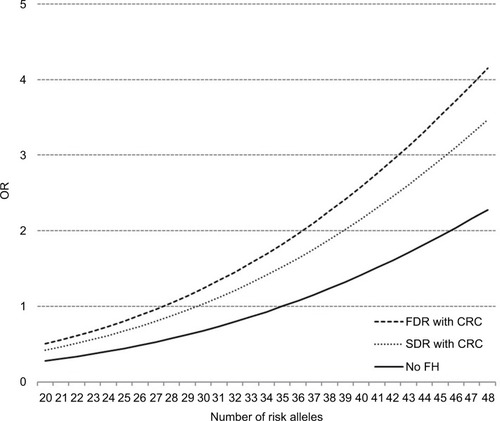
Table 4 ORs with 95% CI for the risk of CRC according to GRS and having a FH of CRC