
Figures & data
Figure 1 Variable importance for the top 30 predictors of 1-year mortality selected by the random forest.
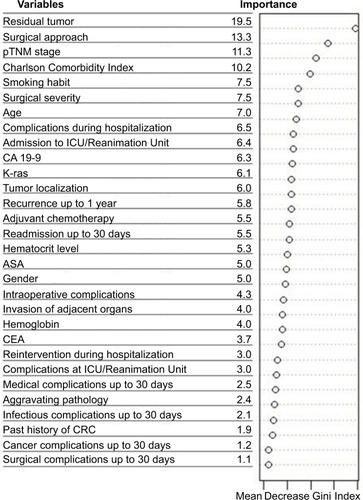
Figure 2 Results of the CART analysis for 1-year mortality in the derivation sample.
Abbreviations: ASA, American Society of Anesthesiologists; CART, classification and regression trees; CCI, Charlson Comorbidity Index; Chem, adjuvant chemotherapy; IntraCom, intraoperative complications; pTNM, histopathologic tumor–node–metastasis; R1y, recurrence of the tumor; ResTum, residual tumor.
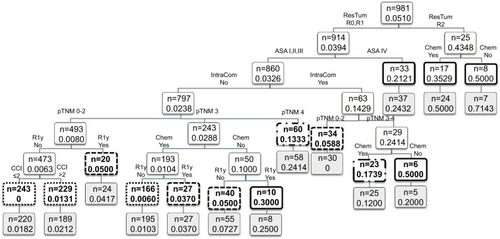
Table 1 Univariate relation of explanatory variables and 1-year mortality in the derivation sample is shown
Figure 3 ROC curve for predicted 1-year mortality by the CART analyses.
Abbreviations: AUC, area under the receiver operating characteristic curve; CART, classification and regression trees; CI, confidence interval; ROC, receiver operating characteristic.
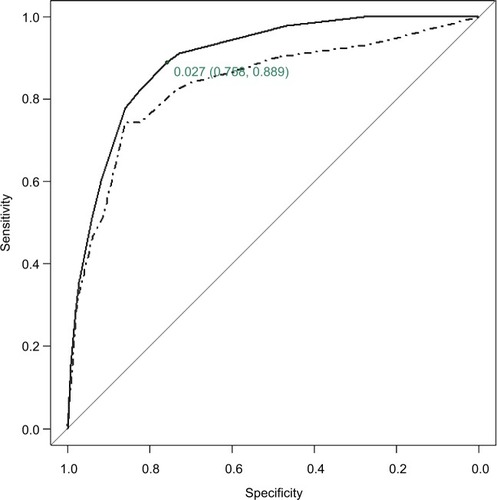
Table 2 Distribution of the subjects depending on the estimated risk of 1-year mortality
Figure S1 Results of internal validation of the CART analysis by bootstrap resampling (N=2000).
Abbreviation: CART, classification and regression trees.
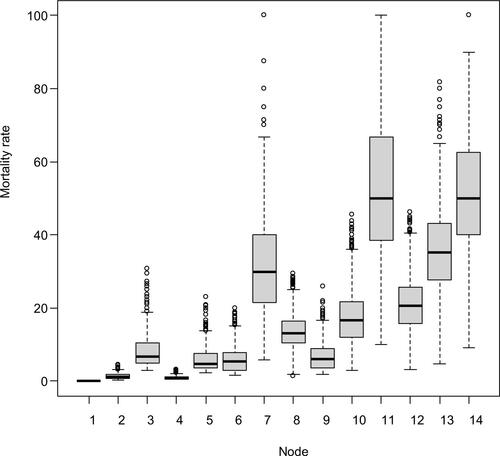
Table S1 Descriptive statistics for explanatory variables stratified by sample (derivation vs validation)
Table S2 Internal validation of the CART analysis by bootstrap resampling (N=2000)