
Figures & data
Figure 1 Acetylsalicylic acid (ASA) exposure and major bleeding outcome information for five hypothetical individuals eligible for Cohorts 1 and 2. The circles denote the first and last prescriptions and the “X”s denote the outcome events, used to define Cohort 1. The dashed lines represent unexposed person-time and the solid lines represent exposed person-time.
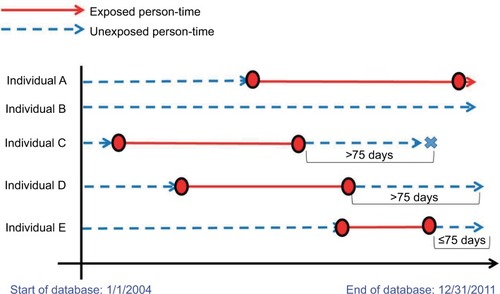
Figure 2 Cohort construction for Cohort 1 (A) using future acetylsalicylic acid (ASA) information and Cohort 2 (B) using contemporary ASA information only.
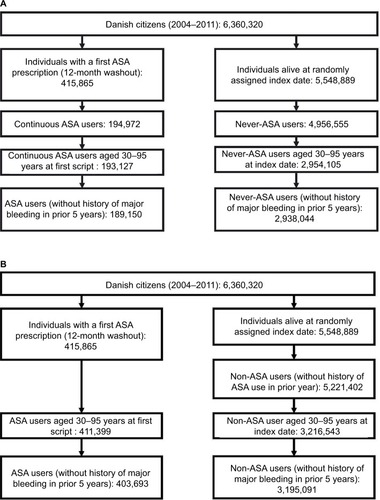
Table 1 Patient characteristics of Cohort 1 (replication cohort)
Table 2 Patient characteristics of Cohort 2 (reconstructed cohort)
Table 3 Association between low-dose ASA use and major bleeding (composite endpoint), cerebral hemorrhage, and gastrointestinal bleeding by cohort before and after propensity-score matching
Figure 3 (A–D) Time-stratified measures of association between low-dose acetylsalicylic acid (ASA) use and major bleeding in Cohorts 1 and 2. Cohort 1 incidence rate differences (IRDs per 1,000 person-years) and incidence rate ratios at 0–89 days, 90–179 days, 180 days to <1 year, 1 to <2 years, and 2–7 years are presented in (A) and (C), respectively. Cohort 2 IRDs and IRRs for the same time periods are presented in (B) and (D), respectively.
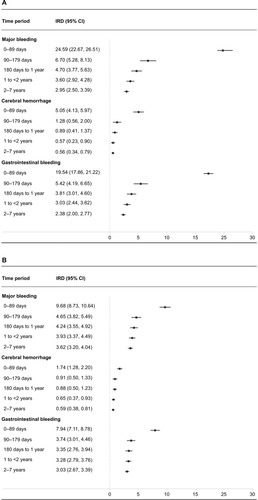
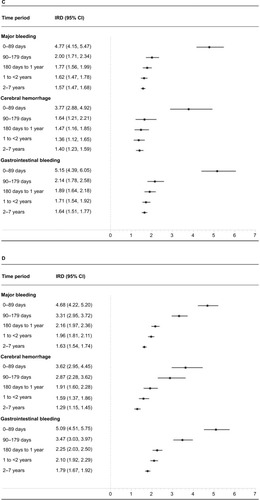
Table S1 Results of sensitivity analyses using a 60-day and 120-day grace period in the Cohort 2