Figures & data
Table 1 Baseline characteristics of adults with diabetes and matched adults without diabetes
Figure 1 Mortality (per 10,000 person-years) among adults with and without diabetes according to time periods defined by three different methods.
Notes: Vertical bars represent 95% confidence intervals. Time periods were categorized according to method 1 (survey years with original follow-up durations), method 2 (follow-up calendar years), and method 3 (survey years with a fixed follow-up of 3 years).
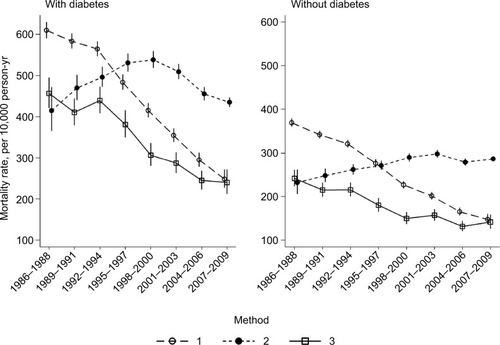
Figure 2 Absolute mortality change over time compared with the mortality in 1986–1988 among adults with and without diabetes.
Notes: Vertical bars represent 95% confidence intervals. Time periods were categorized according to method 1 (survey years with original follow-up durations), method 2 (follow-up calendar years), and method 3 (survey years with a fixed follow-up of 3 years).
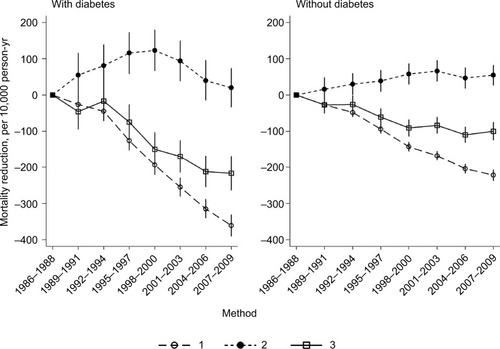
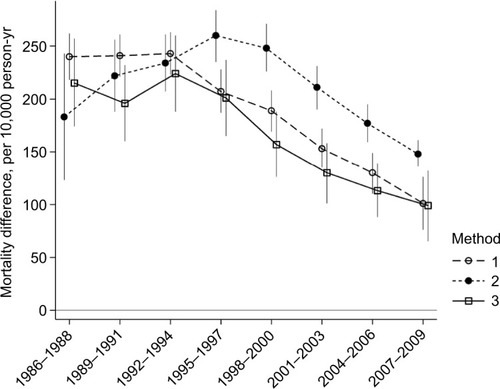
Figure 3 Absolute mortality risk differences (per 10,000 person-years) between adults with and without diabetes.
Notes: Vertical bars represent 95% confidence intervals. Time periods were categorized according to method 1 (survey years with original follow-up durations), method 2 (follow-up calendar years), and method 3 (survey years with a fixed follow-up of 3 years).