Figures & data
Table 1 Five operational definitions of sarcopenia and the cutoff limits applied
Table 2 Description of five screening strategies for sarcopenia
Figure 1 Description of the participant population analyzed.
Abbreviation: SarcoPhAge, Sarcopenia and Physical Impairment with Advancing Age.
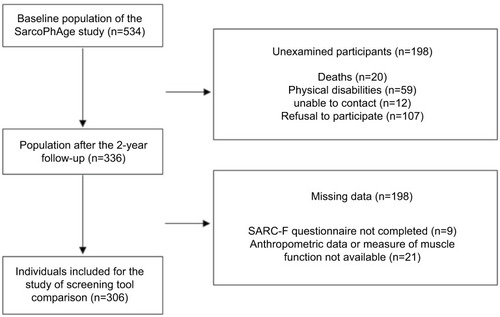
Table 3 Summary of participant characteristics (n=306)
Table 4 Concordance between the five diagnostic definitions of sarcopenia and between the five screening methods
Table 5 Indicators of performance of five screening methods across five definitions of sarcopenia (n=306)
Table 6 Association between the five definitions of sarcopenia and five screening tools (n=306)
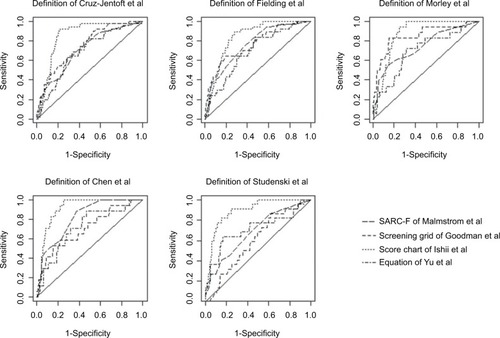
Figure 2 ROC curves for comparisons of the five diagnostic definitions of sarcopenia.
Abbreviation: ROC, receiver operating characteristic.