
Figures & data
Table 1 Sex and age distribution among all oral glucocorticoid use and multiple-prescription use, Denmark, January 1, 1996 – December 31, 2014
Table 2 Number of prescriptions and DDDs redeemed by all oral glucocorticoid use and multiple-prescription use by medication subtype, Denmark, January 1, 1996–December 31, 2014
Figure 1 Estimated 80th, 90th, 95th and 99th percentiles for prescription duration (days) in users of oral glucocorticoids, based on the parametric waiting time distribution.
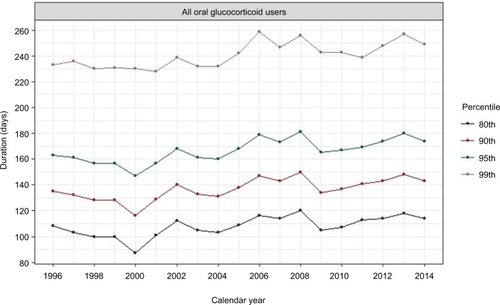
Figure 2 Estimated 80th, 90th, 95th and 99th percentiles for prescription duration (days) in users of oral glucocorticoids using the parametric waiting time distribution, stratified by sex and age group.
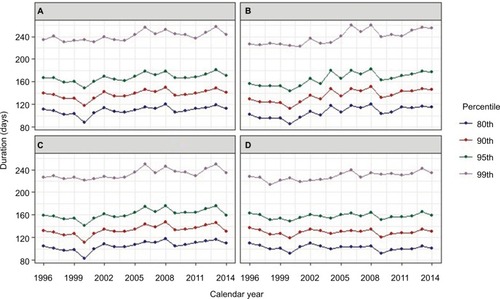
Figure 3 Estimated 80th, 90th, 95th and 99th percentiles for prescription duration (days) in users of oral glucocorticoids using the parametric waiting time distribution, stratified by number of tablets dispensed (number of tablets in a package × number of packages dispensed).
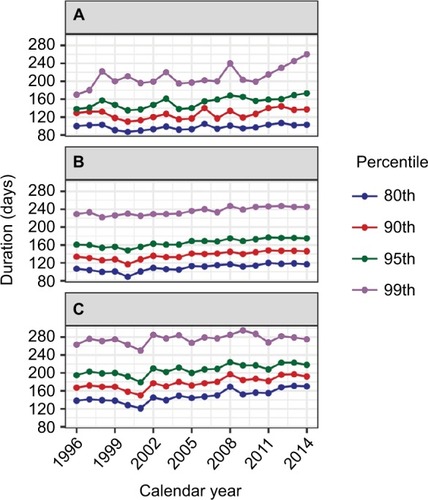
Table S1 ATC codes for glucocorticoids
Table S2 Estimated 80th, 90th, 95th and 99th percentiles for prescription duration (days) in users of oral glucocorticoids using the parametric waiting time distribution, stratified by amount dispensed (amount in a package × number of packages)
Table S3 Estimated 80th, 90th, 95th, and 99th percentiles for prescription duration (days) in multiple-prescription use of oral glucocorticoids using the parametric waiting time distribution, by calendar year
Table S4 Duration (days) of first oral glucocorticoid continous treatment episodes among all use and multiple-prescription use estimated by the Kaplan–Meier survival function and presented as 1st, 5th, 10th, 25th, 50th, 75th, 90th, 95th and 99th percentiles