
Figures & data
Table 1 Descriptive information, number (percentage of non-missing values within each variable) if not else stated
Figure 1 Observed proportion with CD by birth weight.
Abbreviations: CD, celiac disease; CI, confidence interval.
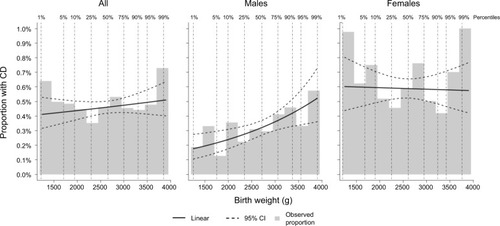
Figure 2 Observed proportion with CD by gestational age-standardized birth weight (z-scores).
Abbreviations: CD, celiac disease; CI, confidence interval.
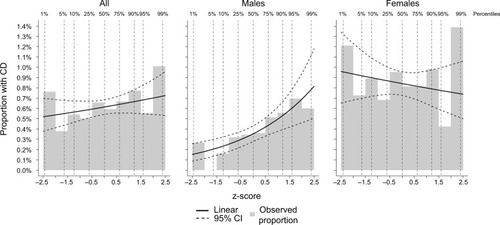
Table 2 Analyses of the association between birth weight and CD, estimate (95% CI)
Table 3 Analyses of the association between z-score (birth weight standardized per gestational age) and CD, estimate (95% CI)
Table 4 Analyses of the association between low birth weight (≤2499 g) and CD, estimate (95% CI)
Figure S1 Observed proportion with CD by birth weight in subsample born in 1980–2004.
Notes: Percentiles refer to the percentage of individuals with a birth weight lower than indicated. Linear refers to a modeled proportion in a logistic regression with an effect that is linear on the log-odds scale. 95% CI refers to 95% bootstrap CIs of modeled proportion with CD based on 10,000 repeats.
Abbreviations: CD, celiac disease; CI, confidence interval.
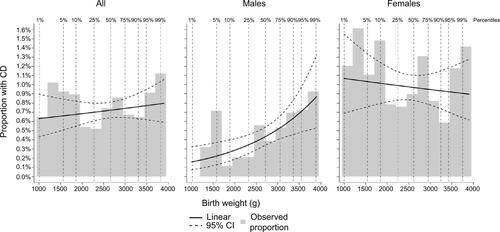
Table S1 Analyses of the association between birth weight and CD, estimate (95% CI)
Table S2 Analyses of the association between birth weight and CD in subsample born in 1980–2004 (N=58,771), estimate (95% CI)
Table S3 Analyses of the association between birth weight and CD among same-sexed twin pairs, estimate (95% CI)
Table S4 Analyses of the association between birth weight and CD stratified by whether twin pair was complete, estimate (95% CI)