Figures & data
Figure 1 Platelet counts, platelet transfusions, and exposure time intervals in a single simulated patient with platelet counts performed every day (A) or every other day (B).
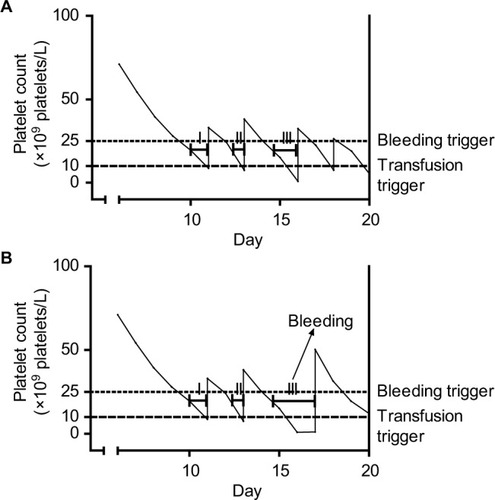
Figure 2 Platelet counts, platelet transfusions, and bleeding probability in two simulated patients.
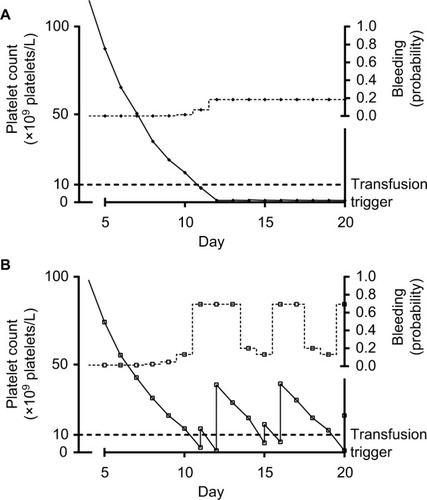
Figure 3 Association between high bleeding risk and high platelet count on day 2 is explained by confounding, caused by low platelet count on day 1, with platelet transfusion on day 1 as an intermediate.
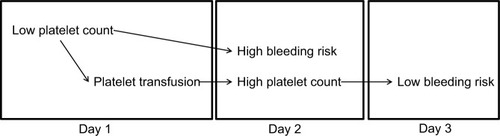
Figure 4 Days with bleeding events according to the morning platelet count, for different platelet count triggers.
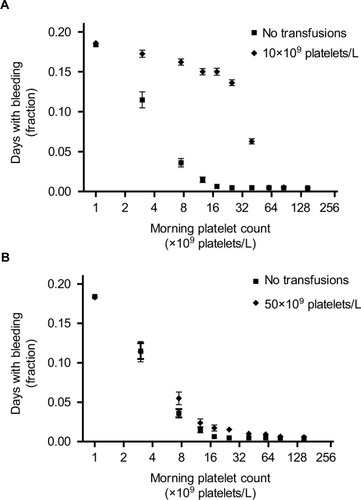
Figure 5 Patients with bleeding events, according to the platelet count used as a trigger for platelet transfusions.
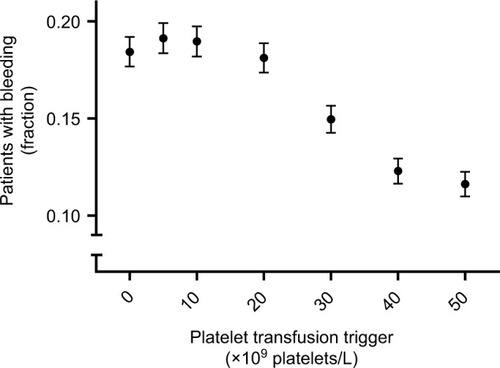
Figure S1 Platelet counts and bleeding events in 25 simulated patients without platelet transfusions (A) or with a transfusion trigger of 50×109 platelets/L (B).
Notes: (A) First 25 patients from the simulation without platelet transfusions. (B) First 25 patients from the simulation with a platelet count trigger of 50×109 platelets/L. Each line represents the consecutive morning platelet counts of a single patient. Markers at the upper right represent bleeding events. Each line of markers represents a single patient’s days with bleeding events. Lines dropping to the bottom of the graph (B) indicate patients becoming refractory to platelet transfusions and therefore remaining at 1×10⁹ platelets/L for the remainder of the simulated period.
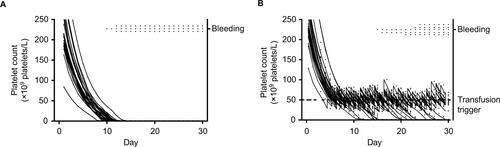
Figure S2 Days with bleeding events according to the morning platelet count, for different platelet count triggers and different assumption violations.
Notes: Markers represent fraction of days, with the indicated morning platelet count, at which patients experience bleeding. (A, B, and C) Results for simulations with different transfusion triggers. Different lines show different assumptions from the sensitivity analyses. Assumptions were adapted incrementally (ie, previous adaptations were maintained, rather than reset, when adding a new adaptation). Circles represent results from the original simulations, squares from simulations with a probability of refractoriness of 0.5% (instead of 5%), diamonds of simulations with a bleeding probability of 0.1% (instead of 0.5%), and triangles of simulations in which bleeding risk did not increase until platelet counts dropped below 5×10⁹ platelets/L. Lines for original simulations and adapted probability of refractoriness overlap.
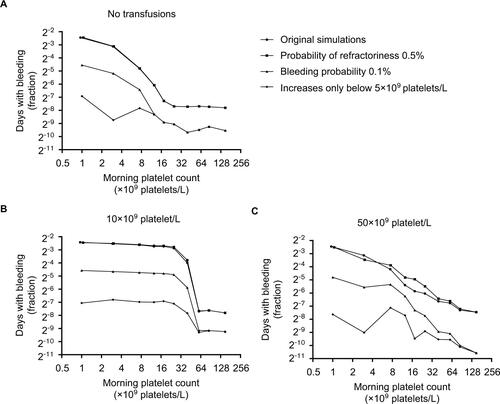
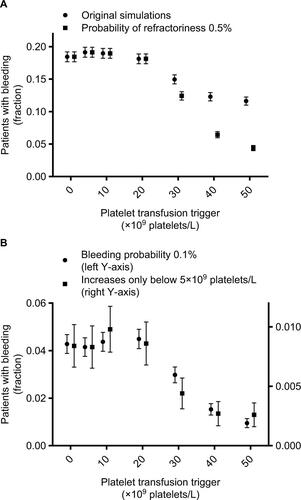
Figure S3 Patients with bleeding events, according to the platelet count used as a trigger for platelet transfusions and different assumption violations.
Notes: Markers represent fraction of patients who experience bleeding at any time during the 30 day simulation period. Error bars represent 95% confidence intervals. Different markers show different assumptions from the sensitivity analyses. Assumptions were adapted incrementally (i.e. previous adaptations were maintained, rather than reset, when adding a new adaptation). Circles (A) represent results from the original simulations, squares (A) from simulations with a probability of refractoriness of 0.5% (instead of 5%), circles (B) of simulations with a bleeding probability of 0.1% (instead of 0.5%), and squares (B) of simulations in which bleeding risk didn’t increase until platelet counts dropped below 5×10⁹ platelets/L.
Note: The lowest platelet count trigger (i.e. 0×109 platelets/L) indicates no platelet transfusions were given, since the minimum simulated platelet count was 109 platelets/L.