
Figures & data
Table 1 Age-standardized 5-year net survivals by cancer and deprivation quintiles (Q1–Q5, from the less to the more deprived) and EHRs for 1-unit increase of the EDI, in men and women, with their 95% confidence intervals
Figure 1 Changes over time since diagnosis of the excess mortality hazard for the 10th, 50th, and 90th percentiles of the age distribution (left, middle, and right column, respectively) and for the 10th, 50th, and 90th percentiles of the EDI distribution (curves with black circles, red triangles, and green crosses, respectively) regarding LOCP in men and women, and melanoma in men; patients diagnosed in 2010.
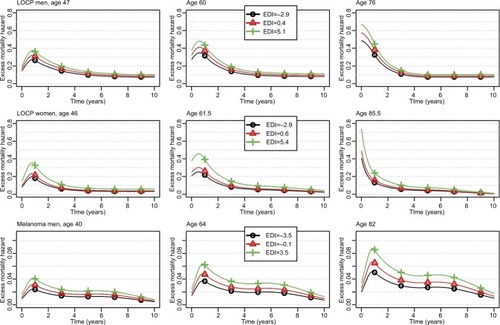
Figure 2 Changes over time since diagnosis of the excess mortality hazard for the 10th, 50th, and 90th percentiles of the age distribution (left, middle, and right column, respectively) and for the 10th, 50th, and 90th percentiles of the EDI distribution (curves with black circles, red triangles, and green crosses, respectively) regarding stomach and pancreas cancers in men, and cervix uteri; patients diagnosed in 2010.
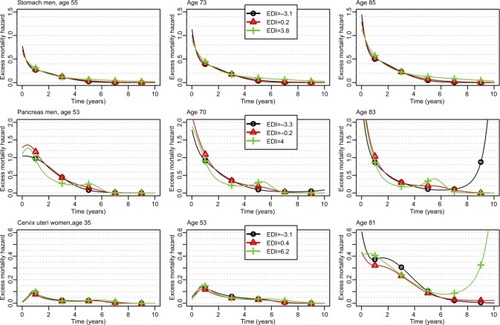
Figure 3 Excess hazard ratio of the EDI on lip–oral cavity–pharynx cancer in men (A) and women (B) with 95% confidence intervals (shaded area).
Abbreviation: EDI, European Deprivation Index.
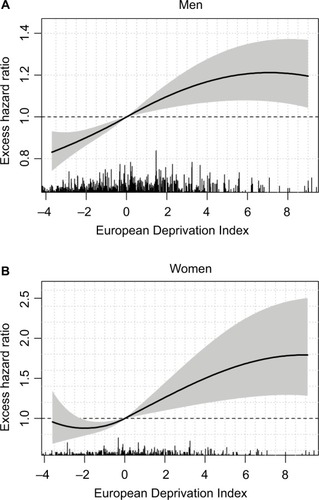
Figure 4 Excess hazard ratio of the EDI at different times after diagnosis for stomach (A) and pancreas (B) cancers in men and cervix uteri (C) cancer in women.
Abbreviation: EDI, European Deprivation Index.
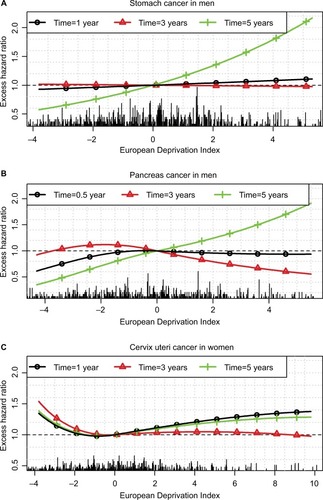
Table 2 Summary of the guidelines for describing the association between socioeconomic inequalities and cancer survival