Figures & data
Figure 1 Flow chart for the study selection of publications on kidney function decline during the pre-dialysis period in CKD 3–5 cohorts and dialysis-based studies.
Abbreviations: CKD, chronic kidney disease; eGFR, estimated glomerular filtration rate; mGFR, measured GFR.
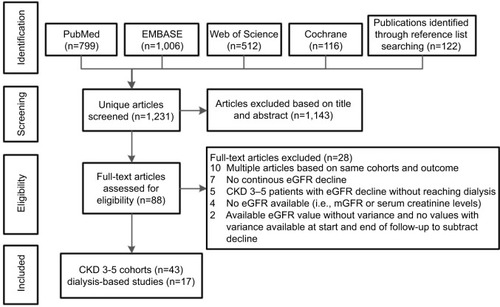
Table 1 Characteristics of included CKD 3–5 cohorts and dialysis-based studies
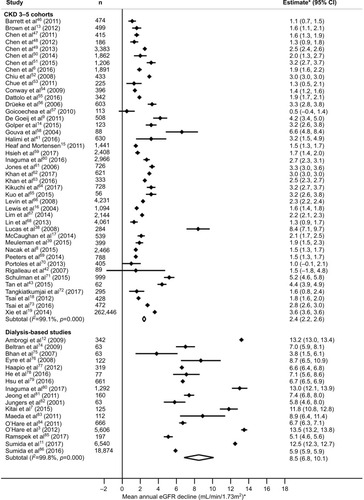
Figure 2 Random-effects meta-analyses of weighted annual eGFR decline during the pre-dialysis period based on CKD 3–5 cohorts or dialysis-based studies.
Notes: Weights are from random effects analysis. Higher values denote higher decline rate.
Abbreviations: CKD, chronic kidney disease; eGFR, estimated glomerular filtration rate.
Abbreviations: CKD, chronic kidney disease; eGFR, estimated glomerular filtration rate.