
Figures & data
Figure 1 Age-standardized incidence and mortality per 100,000 cases of liver cancer in urban Shanghai from 1973 to 2012 stratified by sex and age group.
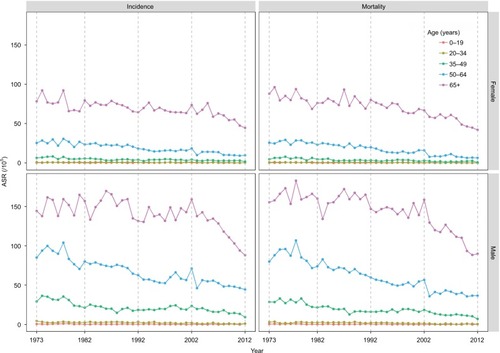
Table 1 Incidence of liver cancer in Shanghai from 1973 to 2012
Table 2 The estimated annual percentage changes of liver cancer incidence in Shanghai from 1973 to 2012
Table 3 Mortality of liver cancer in Shanghai from 1973 to 2012
Table 4 The estimated annual percentage changes of liver cancer mortality in Shanghai from 1973 to 2012
Figure 2 Age-standardized incidence and mortality per 100,000 cases of liver cancer in urban Shanghai from 1973 to 2012 by birth cohort and age.
Notes: (A) Incidence in males; (B) incidence in females; (C) mortality in males; (D) mortality in females.
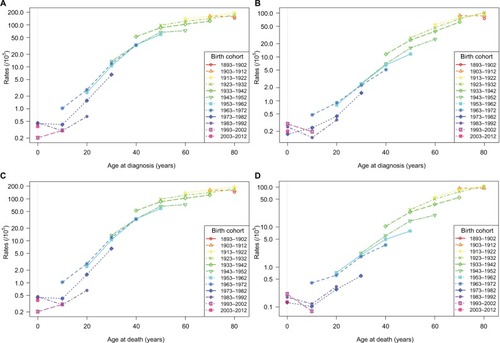
Figure 3 Age-standardized incidence and mortality per 100,000 cases of liver cancer in urban Shanghai from 1973 to 2012 by time period and age.
Notes: (A) Incidence in males; (B) incidence in females; (C) mortality in males; (D) mortality in females.
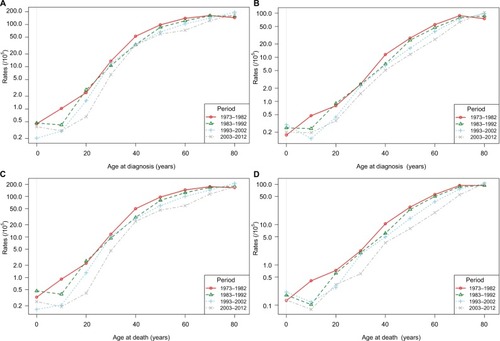
Figure 4 Age-specific liver cancer incidence and mortality forecasts in urban Shanghai from 2013 to 2020.
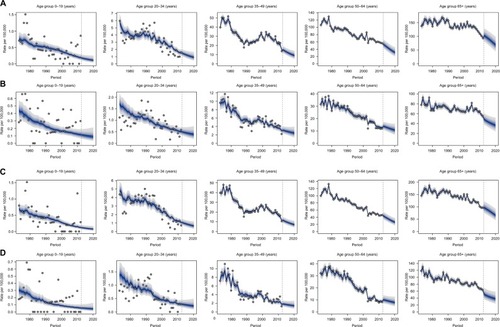
Figure S1 Estimated effects of liver cancer incidence from the age–period–cohort model in males and females from 1973 to 2012 in Shanghai, China.
Notes: The left curve shows the fitted age-specific rates for 105 person-years at risk during the reference cohort (1931.5 in male and 1926.5 in female), the middle curve displays the rate ratios of cohorts relative to the reference cohort (1931.5 in male and 1926.5 in female), and the right curve shows the rate ratios of period conditional on the estimated age and cohort effects relative to the reference period (2005). The open circle in the cohort–effect curve represents the reference birth cohort.
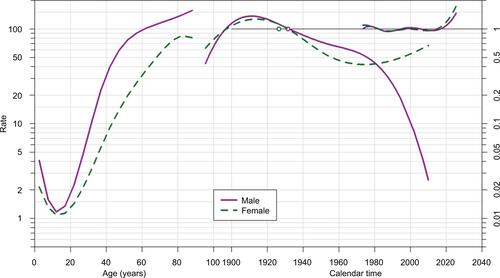
Figure S2 Estimated effects of liver cancer mortality from the age–period–cohort model in males and females from 1973 to 2012 in Shanghai, China.
Notes: The left curve shows the fitted age-specific rates for 105 person-years at risk during the reference cohort (1930.5 in male and 1958.5 in female), the middle curve displays the rate ratios of cohorts relative to the reference cohort (1930.5 in male and 1958.5 in female), and the right curve shows the rate ratios of period conditional on the estimated age and cohort effects relative to the reference period (2005). The open circle in cohort–effect curve represents the reference birth cohort.
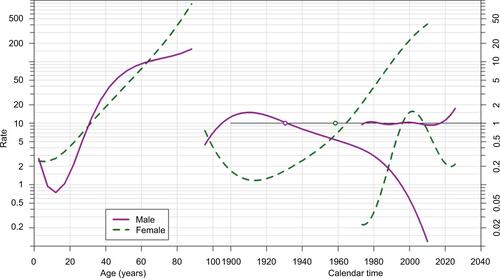
Table S1 Fitting of the age–period–cohort models for the liver cancer incidence and mortality in Shanghai from 1973 to 2012
Table S2 The projection of liver cancer incidence in Shanghai from 2013 to 2020 based on the registry data, 1973–2012
Table S3 The projection of liver cancer mortality in Shanghai from 2013 to 2020 based on the registry data, 1973–2012