Figures & data
Table 1 Distribution of cancer incidence (A) and mortality (B). Incidence and mortality values represent the period 2006–2015
Figure 1 Upcoming shift in population age distribution increases the number of new cancer cases.
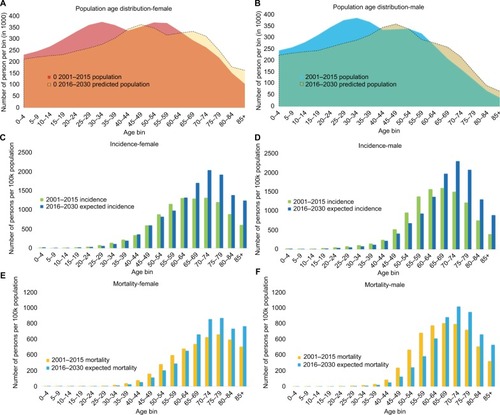
Figure 2 Standardized cancer rates remain steady while a positive gain in annual percent change (APC) leads to increasing crude rates.
Abbreviation: n.s., not significant.
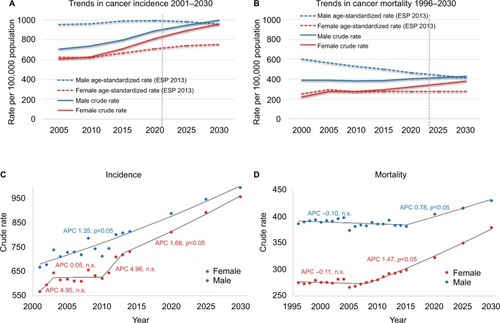
Figure 3 Trends in incidence (A and B) and mortality (C and D) in the five most common cancers by sex.
Abbreviation: ESP, European Standard population.
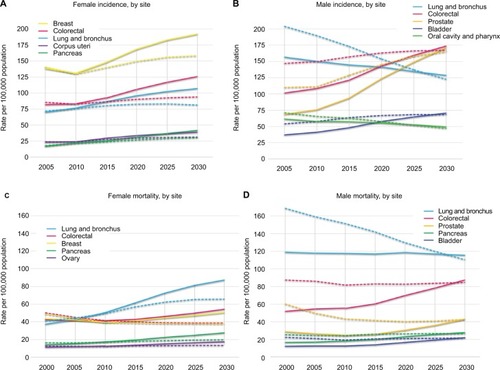
Table 2 Mean annual percent change (APC) and 95% CI by sex in crude rate of incidence (A) and mortality (B) by site and time
Table 3 Ranking of incidence (A) and mortality (B) by expected percentages of the top 10 tumor types in males and females in 2020, 2025, and 2030
Table 4 The five most common cancers estimated for 2020, 2025, and 2030 split by age and sex – incidence (A) and mortality (B)
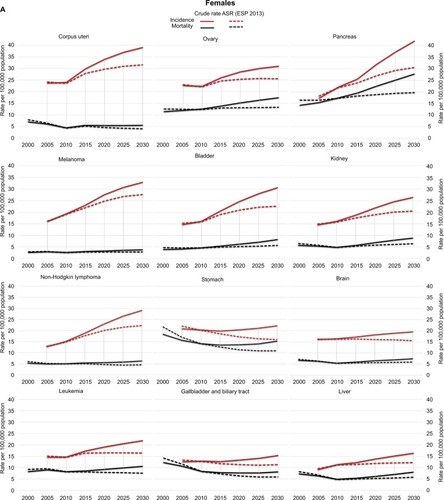
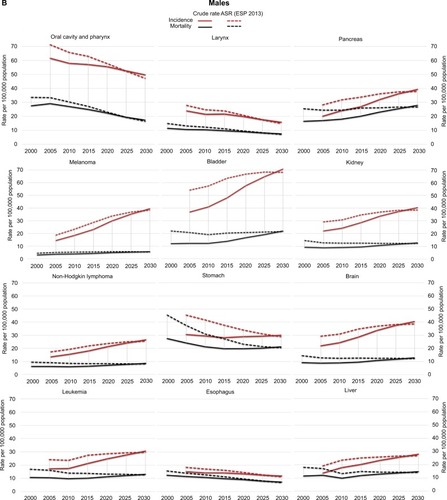
Figure 4 Observed and projected tendencies of incidence and mortality in selected cancers in females (A) and males (B).
Abbreviations: ASR, age-standardized rate; ESP, European Standard Population.