Figures & data
Figure 1 Flow diagram of included studies.
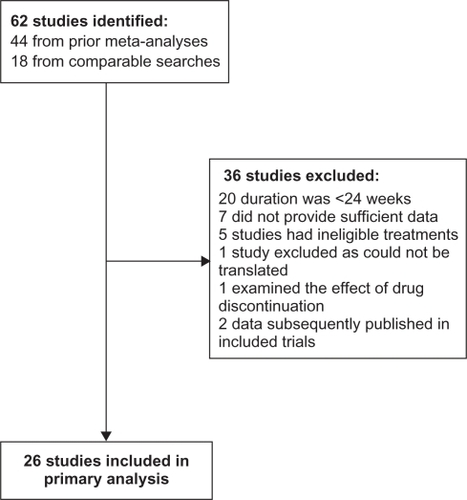
Table 1A Overview of included clinical trials that provide data on the total number of exacerbations and/or the mean annual rate of exacerbations
Table 1B Overview of additional included clinical trials that provide data on the number of patients with at least one exacerbation
Figure 2 Diagram displaying the network of 10 treatments involved in the MTC analyses of the COPD data. Each treatment is a node in the network. The links between nodes are used to indicate a direct comparison between pairs of treatments. The numbers shown along the link lines indicate the number of trials comparing pairs of treatments head-to-head.
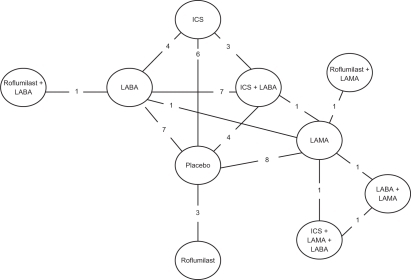
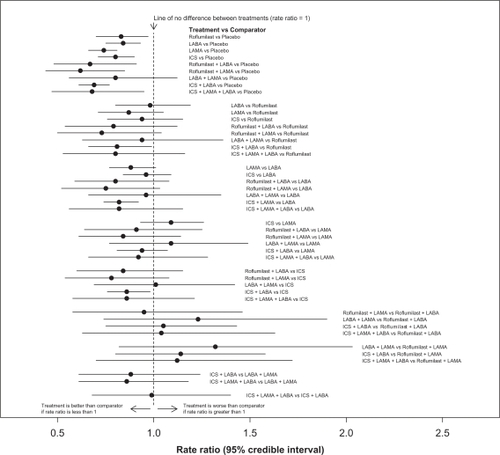
Figure 3 Comparisons of all 10 different treatments for management of COPD. Rate ratios and associated 95% confidence intervals were obtained from a random-effects MTC model without covariates.
Appendix Table 7 Random effects, direct (head to head) evaluation using DerSimmonian Laird random-effects model. Exacerbation rates
Appendix Table 8 Random effects, direct (head to head) evaluation using DerSimmonian Laird random-effects model. Binomial model
Table 2 Estimated rate ratios and 95% CI for the relative effects of pairs of treatments, produced by the random-effects MTC model without covariates
Table 3 Absolute treatment effects corresponding to the 10 treatments for the management of COPD as derived from the primary analysis
Table 4 Probability each of the 10 treatments for management of COPD is best, obtained on the basis of the random-effects MTC model without covariates
Table 5 Estimated rate ratios and 95% CI for the effects of specific pairs of treatment combinations, produced by the additive main effects model considered in our secondary MTC analysis
Table 6 Absolute treatment effects corresponding to the 15 treatments for the management of COPD (ie, 5 single treatments plus 10 combinations of active treatments), obtained on the basis of the additive main effects model considered in our secondary MTC analysis
Table 7 Probability each of the 15 treatments (ie, 5 single treatments plus 10 combinations of active treatments) for management of COPD is best, obtained on the basis of the additive main effects model considered in our secondary MTC analysis
Appendix Table 1 Estimated rate ratios and associated 95% CI for the relative effects of pairs of treatments for the management of COPD, produced by the fixed-effect MTC model without covariates
Appendix Table 3 Probability that each of the 10 treatments for management of COPD is best, obtained on the basis of the fixed-effect MTC model without covariates
Appendix Table 4 Estimated relative risks and 95% confidence intervals for all pairs of treatments produced by the random-effects MTC model without covariates. Binomial model
Appendix Table 6 Probability each of the 10 treatments for management of COPD is best, obtained on the basis of the random-effects MTC model without covariates. Binomial model
Appendix Table 9 Estimated rate ratios and associated 95% CI for the relative effects of pairs of treatments for the management of COPD, produced by random effects MTC involving previously unpublished roflumilast data (M2-111 trial)Citation28
Appendix Table 12 Estimated rate ratios and 95% CI for the effects of specific pairs of treatment combinations, produced by the additive main effects model considered in our MTC analysis including previously unpublished data (M2-111)Citation28
Appendix Table 2 Absolute treatment effects corresponding to the 10 treatments for the management of COPD, as derived from the fixed-effect MTC model without covariates
Appendix Table 5 Absolute treatment effects obtained from the random-effects MTC model on binomial model
Appendix Table 10 Absolute treatment effects obtained from the random-effects MTC model including previously unpublished roflumilast data (M2-111 trial)Citation28
Appendix Table 11 Probability each of the 15 treatments (ie, 5 single treatments plus 10 combinations of active treatments) for management of COPD is best, obtained on the basis of the additive main effects model considered in our secondary MTC analysis. This table includes previously unpublished roflumilast data (M2-111 trial)Citation28