
Figures & data
Table 1 Baseline characteristics of the two study cohorts (values are numbers (%) unless stated otherwise)
Figure 1 Kaplan–Meier survival curve for initiators of proton pump inhibitors and histamine H2 receptor antagonists.
Abbreviations: H2RA, histamine H2 receptor antagonist; PPI, proton pump inhibitor.
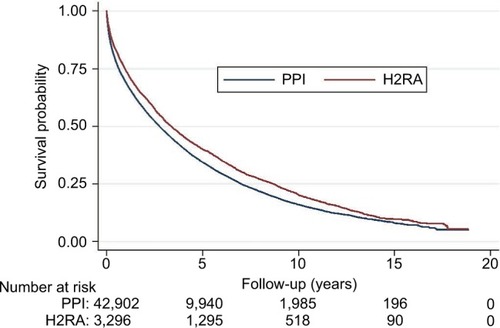
Table 2 Association between histamine H2 receptor antagonists and all-cause mortality by follow-up interval
Table 3 Association between histamine H2 receptor antagonists and cause-specific mortality by follow-up interval
Figure 2 One-year all-cause mortality in subgroups of heart failure patients, comparing new users of H2RA and new users of PPIs.
Notes: Adjusted by age group, sex, index-year categories, time from heart failure diagnosis until first prescription for PPI or H2RA, coronary artery disease, valvular heart disease, hypertension, atrial fibrillation or atrial flutter, venous thromboembolism, stroke, intermittent claudication, diabetes mellitus, obesity, cancer within 1 year, chronic pulmonary disease, chronic kidney disease, dementia, depression, illicit drug abuse/alcohol abuse/smoking, peptic ulcer disease, gastroesophageal reflux disease, anemia, chronic liver disease, alcoholism-related disorders, musculoskeletal disorders, inflammatory bowel disease, cardiac surgery within past 90 days (coronary artery bypass graft surgery and percutaneous coronary intervention), comedication within past 90 days (beta blockers, angiotensin-converting enzyme inhibitors or angiotensin receptor II blockers, diuretics, statins, NSAIDs, antithrombotics, benzodiazepines, and opioids), income, and employment (except the stratifying variable).
Abbreviations: ACEI/ARB, angiotensin-converting enzyme inhibitor/angiotensin receptor II blocker; H2RA, histamine H2 receptor antagonist; PPI, proton pump inhibitor; NSAIDs, nonsteroidal anti-inflammatory drugs.
Abbreviations: ACEI/ARB, angiotensin-converting enzyme inhibitor/angiotensin receptor II blocker; H2RA, histamine H2 receptor antagonist; PPI, proton pump inhibitor; NSAIDs, nonsteroidal anti-inflammatory drugs.
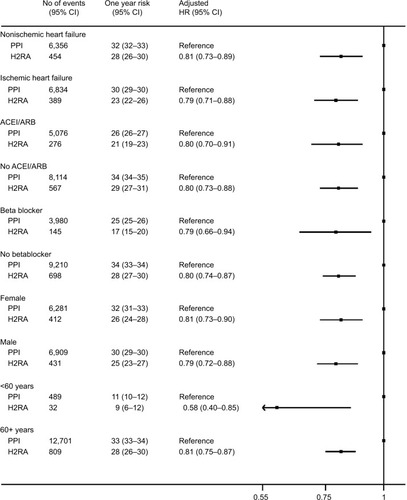
Table 4 Association between H2RA and hospitalization due to worsening of heart failure by follow-up interval