283
Views
24
CrossRef citations to date
0
Altmetric
Original Research

Epidemiology of heart failure and trends in diagnostic work-up: a retrospective, population-based cohort study in Sweden

, , , , , , , , & show all
Pages 231-244 | Published online: 22 Mar 2019

Figures & data

Figure 1 (A) Study timelines (analysis and look-back periods) for cohort 1 (national cohort) and cohort 2 (counties of Uppsala and Västerbotten) and (B) patient flow for cohort 1 (national cohort) and cohort 2 (counties of Uppsala and Västerbotten).

Notes: aThe look-back for NPR data in cohort 2 extended from the same time points as for cohort 1 and ended on December 31, 2009; bLook-back period extended from January 1, 1997 for inpatient care and January 1, 2001 for outpatient care; cIncident HF patient population (prevalent HF population classified as those patients in whom HF was diagnosed during the look-back period and who survived into the analysis period). In cohort 1, data from 845,276 patients were extracted from the Swedish NPR on the basis of an observed HF diagnosis between 1997 and 2013, of which data for 174,537 patients met the inclusion criteria of at least two HF diagnoses in the analysis period (2005–2013) with no HF diagnosis in the look-back period (1997–2004). In cohort 2, data from 33,120 patients were extracted from the EMRs on the basis of an observed HF diagnosis between 1994 and 2015 (Uppsala County) and between 1992 and 2016 (Västerbotten County), of which data for 8,702 patients met the inclusion criteria of at least two HF diagnoses in the analysis period (2010–2015) and no HF diagnosis in the look-back period (NPR; 1997–2009, EMR; 1992–2009). The prevalent population (cohort 1, n=273,999; cohort 2, n=16,962) comprised those with a diagnosis of HF in the look-back period who were alive during the analysis period. The incident HF population comprised those with no HF diagnosis in the look-back periods.
Abbreviations: EMR, electronic medical record; HF, heart failure; HFpEF, heart failure with preserved ejection fraction; HFrEF, heart failure with reduced ejection fraction; NPR, National Patient Register.
Figure 1 (A) Study timelines (analysis and look-back periods) for cohort 1 (national cohort) and cohort 2 (counties of Uppsala and Västerbotten) and (B) patient flow for cohort 1 (national cohort) and cohort 2 (counties of Uppsala and Västerbotten).

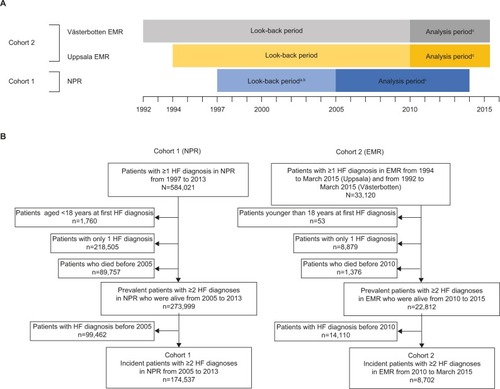
Table 1 Patient demographics and clinical characteristics at baseline for cohort 1 and cohort 2, overall and by HF phenotype (incident patient populations)

Figure 2 Annual incidence per 1,000 inhabitants and prevalence of HF during 2010–2014 in Sweden (cohort 1) and in the counties of Uppsala and Västerbotten (cohort 2).

Notes: (A) Total age-adjusted; and (B) crude incidence and prevalence by age group. Estimates are based on data from the NPR (cohorts 1 and 2) and from primary and secondary care EMRs (cohort 2) for the period 2010–2014. Age-adjusted incidence and prevalence calculated using population weights based on the Swedish population in 2015.Citation16 aSecond HF diagnosis used as the index date.
Abbreviations: EMRs, electronic medical records; HF, heart failure; NPr, National Patient Register.
Figure 2 Annual incidence per 1,000 inhabitants and prevalence of HF during 2010–2014 in Sweden (cohort 1) and in the counties of Uppsala and Västerbotten (cohort 2).

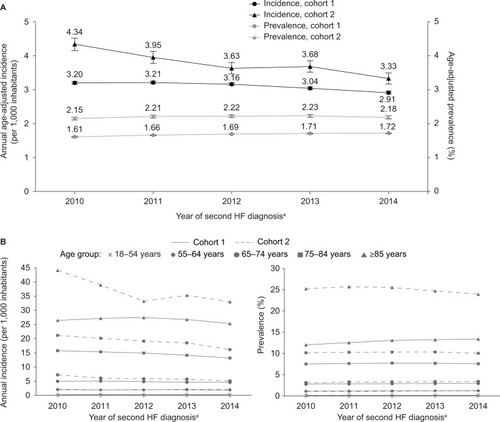
Table 2 Key laboratory measures at baseline for cohort 2, overall and by HF phenotype (incident patient population)

Figure 3 Diagnostic work-up of patients in cohort 2 in the 6 months before and after the year of first HF diagnosis: (A) by index year and (B) according to setting of HF diagnosis.

Note: aFirst HF diagnosis used as the index date.
Abbreviations: Echo, echocardiography; HF, heart failure; NT-proBNP, N-terminal pro-B-type natriuretic peptide.
Figure 3 Diagnostic work-up of patients in cohort 2 in the 6 months before and after the year of first HF diagnosis: (A) by index year and (B) according to setting of HF diagnosis.

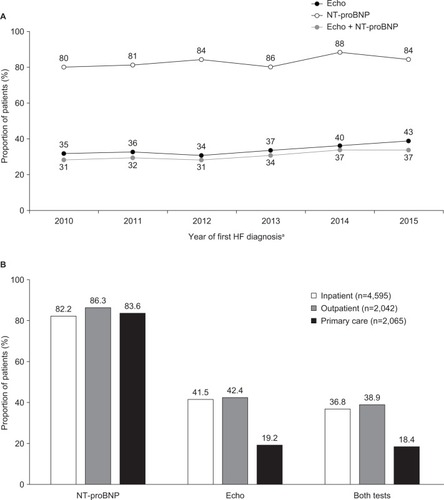
Table 3 COX and Fine and Gray regression analyses of 1-year all-cause and CVD-related mortality with Kaplan–Meier and cumulative incidence function estimates for 1-year mortality (cohort 1, incident HF population)

Figure 4 Trends in the most common causes of death for the prevalent HF population (cohort 1) between 2005 and 2013.

Notes: The percentages are relative to the number of all-cause deaths. “n” represents the number of prevalent patients at each year. Trends were significant (P<0.0001, Cochran–Armitage test) for chronic IHD, MI, HF, AF, and flutter over time.
Abbreviations: AF, atrial fibrillation; HF, heart failure; IHD, ischemic heart disease; MI, myocardial infarction; NSTEMI, non-ST-elevation myocardial infarction; STEMI, ST-elevation myocardial infarction.
Figure 4 Trends in the most common causes of death for the prevalent HF population (cohort 1) between 2005 and 2013.

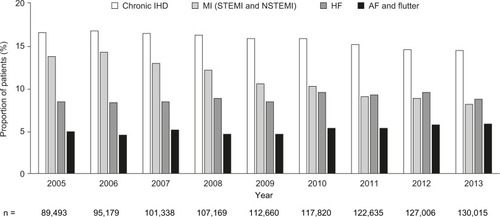
Table 4 COX and Fine and Gray regression analyses of 1-year all-cause and CVD-related mortality with Kaplan–Meier and cumulative incidence function estimates for 1-year mortality (cohort 2, incident HF population)

Data availability

Major findings from the study will be published in scientific manuscripts only. The data will not be made available in any other format in order to preserve the privacy of the patients in compliance with local laws and regulation.