
Figures & data
Figure 1 Graphical representation of the different measures using simulated data: the overall survival probability (dashed black curve), the 10-year RMST (lower shaded area), the NLYL at 10 years according to each cause (NLYLcancer – upper shaded area and NLYLother – middle shaded area, which sum up to give the RMTL), and the curves of the CPD due to cancer (CPDcancer) and due to other causes (CPDother), using a (reverse) stacked display format.
Abbreviations: CPD, crude probability of death; NLYL, number of life years lost; RMST, restricted mean survival time; RMTL, restricted mean time lost.
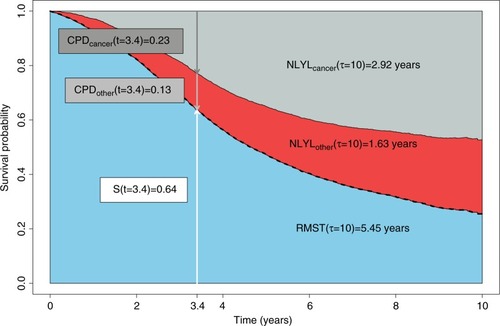
Table 1 Equation, interpretation and general comments of the statistical measures detailed in this work for summarizing survival data, where λ defines the overall mortality hazard, and λN(u) the net mortality hazard due to the disease under study. The cumulative net hazard is estimated using the Pohar-Perme estimator.Citation23 Refer the “Theoretical framework” section for the definition of λN(u), λC(u) and λP(u).
Table 2 Number of cases (K) and deaths (D) observed before December 31, 2014, in men aged between 15 and 80 years old at diagnosis and diagnosed between 2001 and 2003 in England, by deprivation and age at diagnosis groups (Deprivation 1 corresponding to the less deprived and 5 to the most deprived)
Table 3 Measures estimated in the classical survival setting, in men aged between 15 and 80 years old at diagnosis by deprivation group (Dep), with their 95% CIs: the survival probability at 10 years after diagnosis S(t=10), the conditional probability of surviving further t=5 years given that a patient already survived s = 5 years CS(t=5|s=5), and the restricted mean survival time at 10 years RMST(τ = 10)
Table 4 Measures estimated in the relative survival setting, in men aged between 15 and 80 years old at diagnosis by deprivation group (Dep), with their 95% CIs: the NS probability at 10 years after diagnosis NS(t = 10), the CNS, CNS(t = 5|s = 5), the RMNST at 10 years RMNST (τ = 10), the crude probability of death at 10 years for cancer FC(t = 10) and other causes FP(t = 10), and the number of life years lost due to cancer NLYLC(τ = 10) and due to other causes NLYLP(τ = 10) over a 10-year time window