Figures & data
Figure 1 Example simulation scenarios for (A) less time points vs (B) more time points; (C) smaller sample size per time point vs (D) larger sample size per time point.
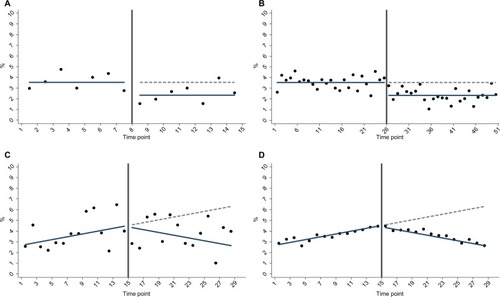
Figure 2 Empiracle power to detect a relative 34% reduction in outcome, where mean pre-intervention incidence is 3.5%: by the number of time points and mean sample size per time point: (A) slope change (B) step change.
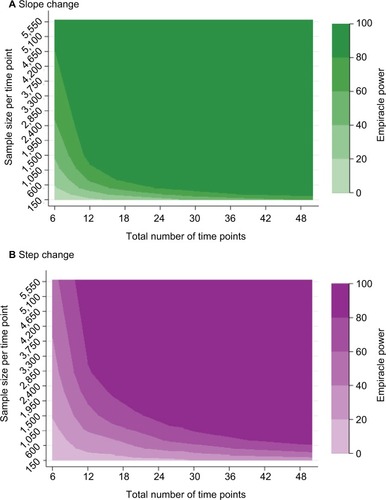
Figure 3 Empirical power in the case studya (stratified by effect size) to detect an intervention resulting in (A) a slope change or (B) step change.
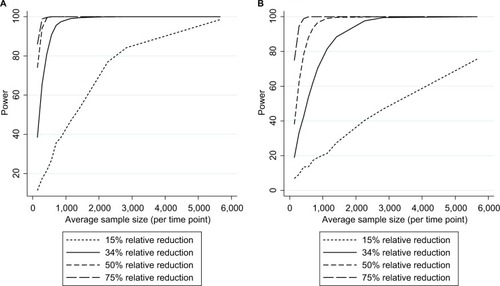
Figure 4 Empirical power in the case studya (stratified by intervention location) to detect an intervention resulting in (A) a slope change or (B) step change.
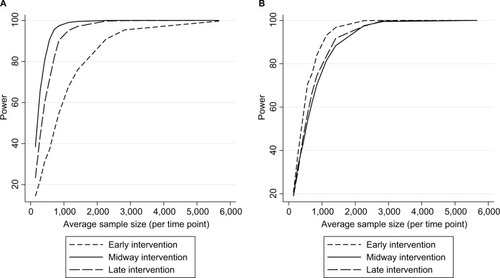
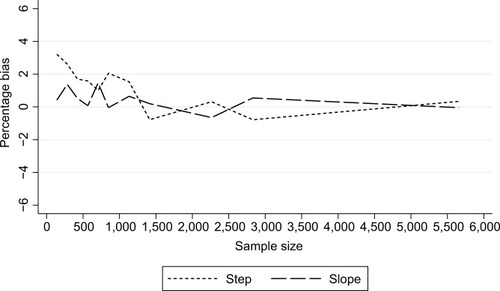
Figure 5 Percentage bias in estimates of intervention impact in the case studya: stratified by the nature of impact.