
Figures & data
Table 1 Important considerations in the design of cohort studies to evaluate treatment effectiveness and how to mitigate the risk of bias
Table 2 Comparison of baseline characteristics from three randomized controlled trials and the present case study
Figure 1 Forest plot comparing our case study (Sharma et al) with meta-analyses of previous RCT examining change in HbA1c (mmol/mol) between sitagliptin and sulfonylurea as add-on to metformin.
Source: Adapted from Sharma M, Beckley N, Nazareth I, Petersen I. Effectiveness of sitagliptin compared to sulfonylureas for type 2 diabetes mellitus inadequately controlled on metformin: a systematic review and meta-analysis. BMJ Open. 2017;7(10):e017260.Citation28
Abbreviations: Dur, duration; Mean diff, mean difference; Sita, sitagliptin; Sulf, sulfonylureas; Tot, total participants; RCT, randomized controlled trial; Obs, observational study; NA, not applicable.
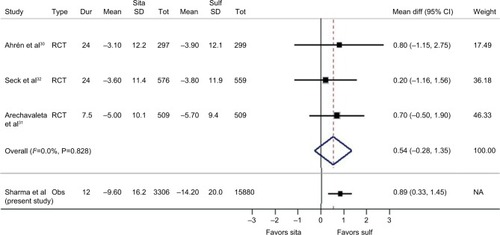
Table 3 Results from the case study: analysis of mean difference in HbA1c (mmol/mol) 12 months after initiation of sitagliptin vs sulfonylureas