Figures & data
Figure 1 (A) Composition of the sample in every follow-up year by 5-year age groups. (B) Composition of the sample in every follow-up year by the educational level.
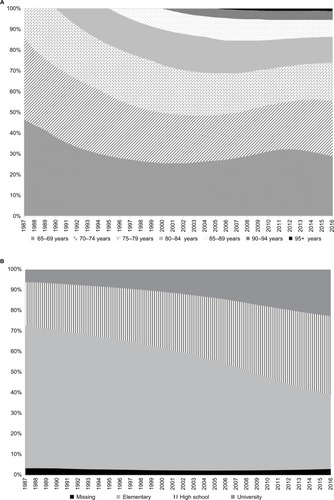
Figure 2 Sex-specific incidence rates of dementia in inpatient register per 10,000 for every year of follow-up period.
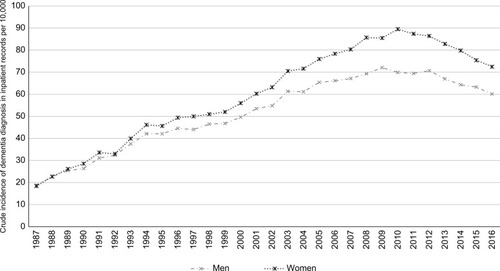
Table 1 Sex-stratified crude incidence rates per 10,000 by age group or educational level during the entire follow-up period (1987–2016)
Figure 3 (A) Age-stratified incidence rates (per 10,000) of first diagnosis of dementia in hospital inpatient records for every year of follow-up in men. (B) Age-stratified incidence rates (per 10,000) of first diagnosis of dementia in hospital inpatient records for every year of follow-up in women.
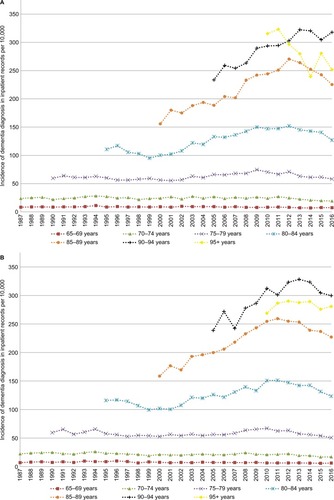
Table 2 Results from stratified discrete time logistics models with a complementary log-log link function
Figure 4 Age- and education-stratified rates (per 10,000) of first diagnosis of dementia in hospital inpatient records for every year of follow-up.
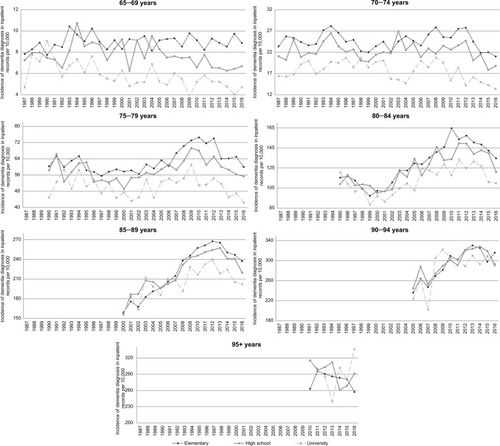
Table 3 Results from discrete time logistics models with a complementary log-log link function stratified by age groups
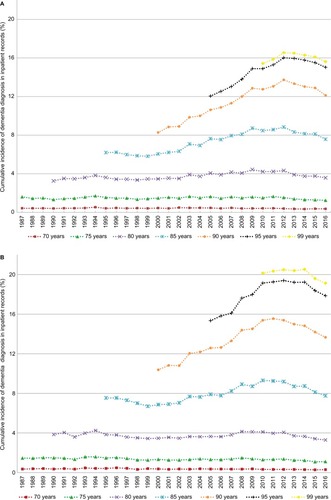
Figure 5 (A) Age-stratified cumulative incidence (%) of first diagnosis of dementia in hospital inpatient records, adjusted for the competing risk of death, for every year of follow-up in men. (B) Age-stratified cumulative incidence (%) of first diagnosis of dementia in hospital inpatient records, adjusted for the competing risk of death, for every year of follow-up in women.