Figures & data
Figure 1 Definitions of observable person-time, in claims data (A) or EHR data (B).
Notes: As shown by a hypothetical patient in (A), claims data observability can be based on the entire time enrolled in a health plan (OC1) or enrolled time that excludes time known to be structurally nonobservable, eg, time during nursing home care (OC2). As shown for a different hypothetical patient in (B), EHR observability can be based on all calendar time, irrespective of event data, assuming that all patient encounters would be captured in that EHR system (OE1), time between the start of the first event and the end of the last event recorded in the EHR system (OE2), or time defined by a “buffer” around each encounter, excluding the time where there is a gap of a certain duration (eg, >365 days) between margins (OE3).
Abbreviations: EHR, electronic health record; OC, observable person-time in claims databases; OE, observable person-time in EHR databases.
Abbreviations: EHR, electronic health record; OC, observable person-time in claims databases; OE, observable person-time in EHR databases.
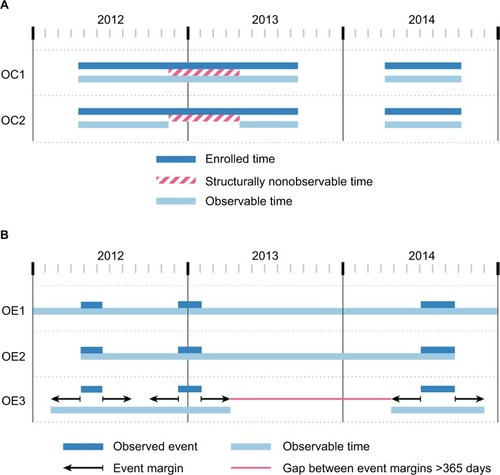
Figure 2 The period of interest and the lookback time.
Notes: Timeline showing 2012 through the end of 2014, with 2014 being the POI and two different LB times, LB1 (all time) and LB2 (1 year fixed time). The observable times of three different hypothetical patients are shown.
Abbreviations: LB time, lookback; POI, period of interest.
Abbreviations: LB time, lookback; POI, period of interest.
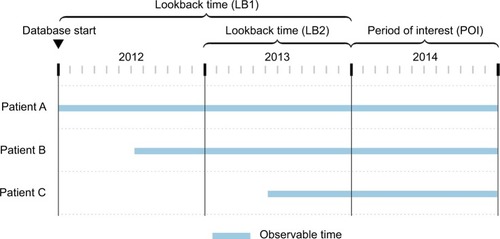
Figure 3 The prevalence numerator.
Notes: PN1 is the point PN, ie, the condition is present as of the first day of the period of interest; and PN2 is the period PN, ie, the condition is either present as of the first day of the POI, or is recorded for the first time during the POI. These are shown for three hypothetical patients. In (A), all time LB (LB1) is used to define the LB time. In (B), fixed-time LB (LB2) is used to define the LB time. The columns at the right indicate the numbers each patient contributes to the respective numerator value, as well as the total numerator values.
Abbreviations: LB, lookback time; PN, prevalence numerator; POI, period of interest.
Abbreviations: LB, lookback time; PN, prevalence numerator; POI, period of interest.
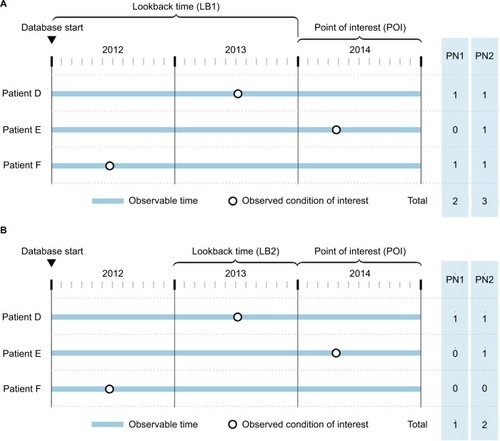
Figure 4 The prevalence denominator results.
Notes: Day 1 population (PD1), complete-period population (PD2), and sufficient-time population (PD4) are shown for three hypothetical patients. For PD4, assume that the requirement is defined as having at least n=90 observable person-days in the period of interest (POI). The columns at the right indicate the numbers each patient contributes to the respective denominator value, as well as the total denominator values.
Abbreviations: LB, lookback time; LO, lookback observability; PD, prevalence denominator; POI, period of interest.
Abbreviations: LB, lookback time; LO, lookback observability; PD, prevalence denominator; POI, period of interest.
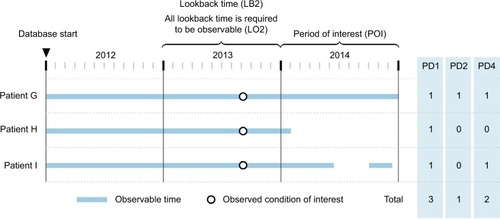
Table 1 Combinations of prevalence numerator and denominator definitions
Figure 5 The incidence numerator and denominator.
Notes: Five hypothetical patients are shown. The columns at right indicate the numbers each patient contributes to the respective numerator or denominator value, as well as the total values, assuming options IPD1 or IRD are used. Dashes (“–”) indicate that the patient was excluded from contributing to the respective value.
Abbreviations: IN, incidence numerator; IPD, incidence proportion denominator; IRD, incidence rate denominator.
Abbreviations: IN, incidence numerator; IPD, incidence proportion denominator; IRD, incidence rate denominator.
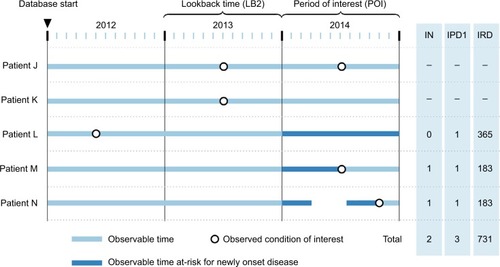
Table 2 Summary of the discussed design choices for prevalence and incidence studies
Table 3 Published prevalence and incidence estimates for the selected diseases
Table 4 Case definitions
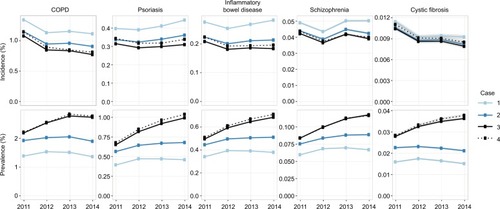
Figure 6 Incidence and parameter estimates, by case examples, in CPRD.
Notes: Cumulative incidence (“incidence”) and point prevalence (“prevalence”) estimates are shown for each of the four cases, across multiple diseases. Case 1: 1-year lookback; Day 1 population. Case 2: 2-year lookback; Day 1 population. Case 3: all-time lookback; Day 1 population. Case 4: all-time lookback; complete-time population. Shaded regions indicate 95% confidence intervals. Tabular estimates are provided in Table S4.
Abbreviation: CRPD, Clinical Practice Research Datalink.
Abbreviation: CRPD, Clinical Practice Research Datalink.
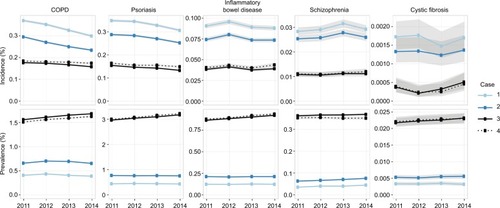
Figure 7 Incidence and parameter estimates, by case examples, in MarketScan.
Notes: Cumulative incidence (“incidence”) and point prevalence (“prevalence”) estimates are shown for each of the four cases, across multiple diseases. Case 1: 1-year lookback; Day 1 population. Case 2: 2-year lookback; Day 1 population. Case 3: all-time lookback; Day 1 population. Case 4: all-time lookback; complete-time population. Shaded regions indicate 95% confidence intervals. Tabular estimates are provided in Table S5.