
Figures & data
Figure 1 Definition of true and false cases of dementia.
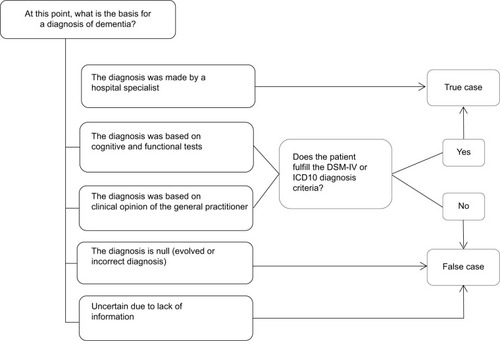
Figure 2 Incidence rate (A) and prevalence (B) of dementia.
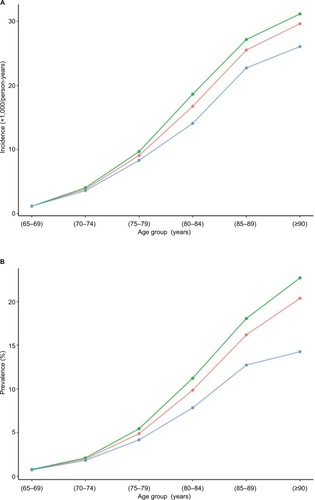
Table 1 Crude and standardized incidence rates of dementia (per 1,000 person-years) in people aged ≥65 years in Catalonia (Spain) in 2016, stratified by sex and age
Table 2 Description of the characteristics of the primary care settings in Catalonia (Spain) in relation to dementia assessment
Table 3 Crude and adjusted prevalence of dementia in people aged ≥65 years in Catalonia (Spain) in 2016, stratified by sex and age
Figure S1 Summary of questionnaire for the validation of dementia diagnosis.
Abbreviations: CIE-10, Código Internacional de Enfermedades (Spanish version of the ICD); DSM, Diagnostic and Statistical Manual of Mental Disorders.
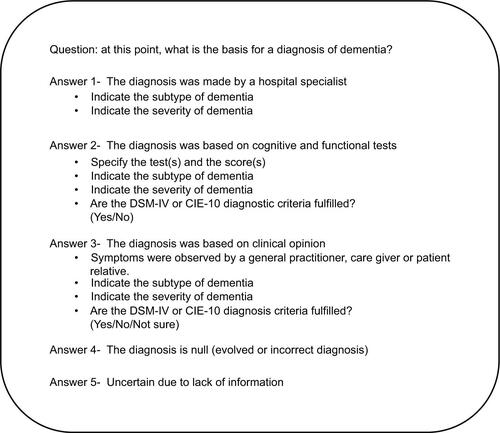
Table S1 Characteristics of study population to estimate incidence rate of dementia
Table S2 Crude incidence rates of dementia (per 1,000 person-years) in people aged ≥65 years in Catalonia (Spain) in 2016, stratified by sex and age
Table S3 Characteristics of study population to estimate dementia prevalence that includes persons aged ≥65 years registered in SIDIAP on December 31, 2016
Table S4 Crude prevalence of dementia in people aged ≥65 years in Catalonia (Spain) in 2016, stratified by sex and age