
Figures & data
Figure 1 Flowchart of candidate code categorization.
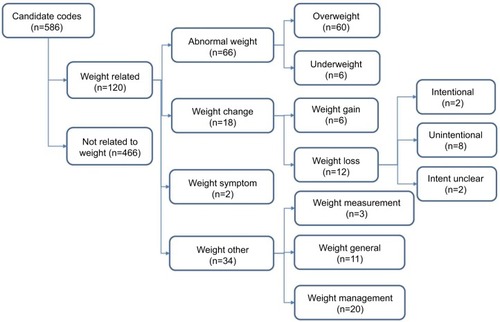
Table 1 The face validity of the 30 most commonly used abnormal weight codes
Table 2 PPV of the most commonly used and specific abnormal weight codes
Figure 2 Comparison of the mean percent weight change estimated using three methods for each weight change code (hollow circles) and combined by weight change group (full circles).
Abbreviation: kg, kilogram.
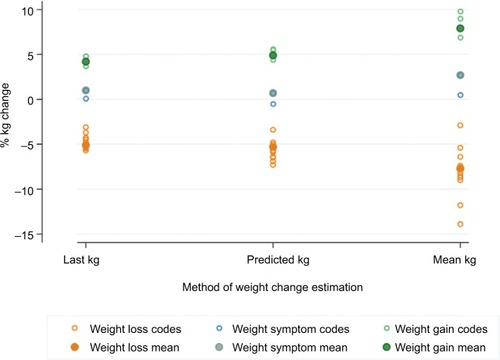
Table 3 Internal validation of weight change Read codes using three methods of percent weight change estimation
Table 4 Weight change by weight change group, gender, and age group for each of the three methods of percent weight change estimation
Table 5 Association between time to previous weight measurement and estimated weight change