
Figures & data
Figure 1 Number of records of each health indicator per 100 person-years by sex and age (in years).
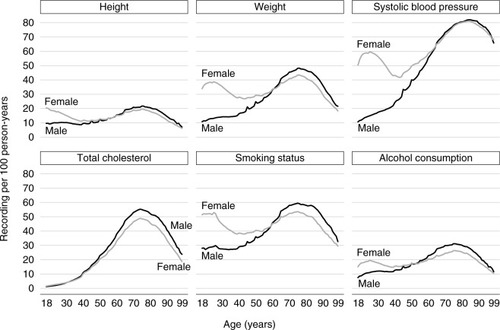
Figure 2 Percentage of individuals with a record of each health indicator in the 2000 (purple), 2005 (teal), and 2010 (orange) registration cohorts by calendar year.
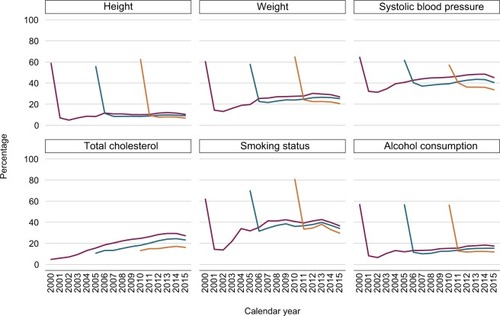
Table 1 Number of individuals, median age at registration, and sex distribution among those who were newly registered with general practices in 2000, 2005, and 2010
Figure 3 Percentage of individuals with a record of each health indicator in the 2000 (purple), 2005 (teal), and 2010 (orange) registration cohorts by calendar year and disease status.
Notes: (A) Diabetes, (B) myocardial infarction, and (C) stroke. The 2000, 2005, and 2010 registration cohorts included individuals who were newly registered with their general practices in 2000, 2005, and 2010, respectively.
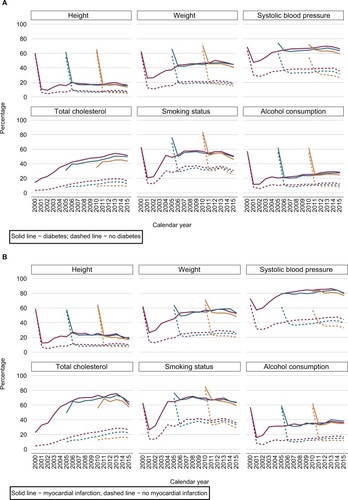
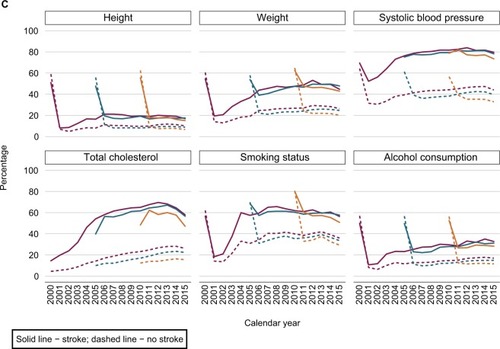
Figure 4 Time (in years) from practice registration to having the first record of each health indicator; and time (in years) at which 1) 50% of the individuals have had their first height, weight, SBP, or alcohol consumption record; 2) 25% of the individuals have had their first total cholesterol record; and 3) 75% of the individuals have had their first smoking status record.
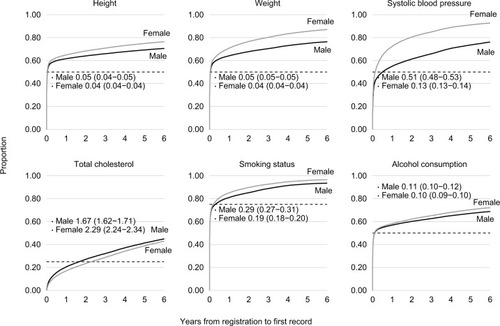
Table 2 Associations of the mean weight measurements and the probability of having weight recorded with sex, age group, social deprivation, and indicators of chronic diseases among individuals who were actively registered in 2010