Figures & data
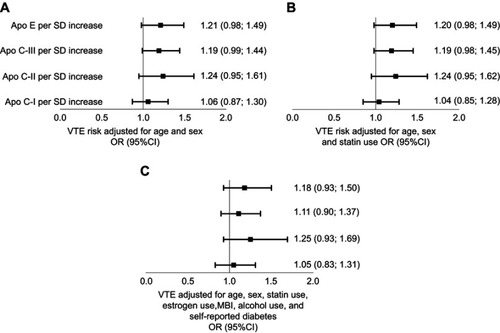
Figure 1 Flow chart of participants selection. Patients and RDD controls were randomly selected from the Multiple Environmental and Genetic Assessment of Risk Factors for Venous Thrombosis study (MEGA), the Netherlands, 1999–2004.
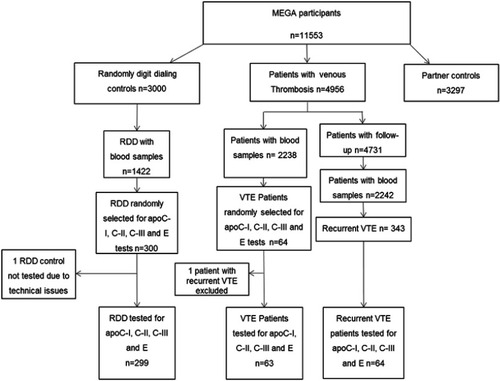
Table 1 Clinical characteristics of patients and RDD controls randomly selected from the Multiple Environmental and Genetic Assessment of Risk Factors for Venous Thrombosis study, the Netherlands, 1999–2004
Table 2 Association of apolipoproteins with levels of hemostatic factors and C-reactive protein in RDD controls randomly selected from the Multiple Environmental and Genetic Assessment of Risk Factors for Venous Thrombosis case–control study, the Netherlands, 1999–2004
Figure 2 Odds ratio of venous thromboembolism for apolipoproteins C-I, C-II, C-III and E levels when comparing patients and RDD controls randomly selected from the Multiple Environmental and Genetic Assessment of Risk Factors for Venous Thrombosis Case–control study, the Netherlands, 1999–2004. The models were adjusted for: (A) age and sex; (B) age, sex and statin use and (C) age, sex, statin use, estrogen use, alcohol intake, body mass index and self-reported diabetes adjusted model. Data show odds ratio (OR) and 95% confidence interval (CI).