Figures & data
Table 1 Summary of data sources and study variables
Figure 1 Flowchart of the study participant in the LCM cohort study.
Abbreviations: LCM, low cost monitoring; ART antiretroviral therapy.
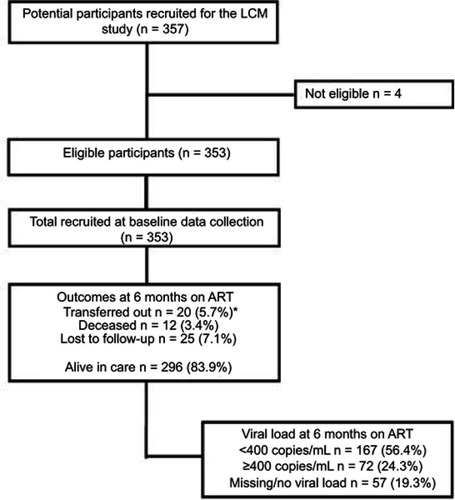
Table 2 Baseline demographic and clinical characteristics of 296 ART-naive patients, stratified by a viral load at 6 months on ART
Table 3 Sensitivity and specificity of self-reported adherence at 6 months on ART compared to viral load as “gold standard”
Table 4 Crude and adjusted predictors of poor virologic suppression at 6 months after ART initiation, using Modified Poisson regression (n=163)
Table 5 Diagnostic accuracy of the clinical prediction pcore (CPS) at different cutoff points at 6 months after ART initiation
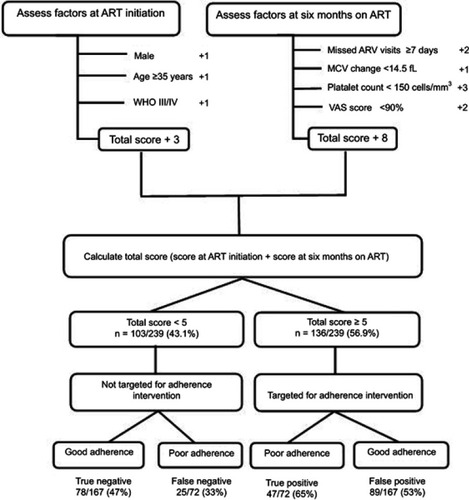
Figure 2 Diagnostic accuracy of the algorithm compared to viral load as “the gold standard”.
Abbreviations: ART, antiretroviral therapy; ARV, antiretroviral; MCV, mean cell volume; VAS, visual analog scale; WHO, World Health Organization.