Figures & data
Figure 1 Study participants. Flow diagram demonstrating the application of exclusion criteria in study cohorts.
Abbreviations: CKD, chronic kidney disease; eGFR, estimated glomerular filtration rate; RCC, renal cell carcinoma.
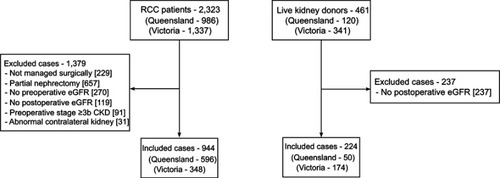
Figure 2 Comparison of (A) pre- and (B) postoperative estimated glomerular filtration rate (eGFR) by patients grouped by age and tumor size/indication. Box and whisker plot of pre- and postoperative eGFR, with patients subgrouped by age and indication. Postoperative kidney function was recorded at approximately 12 months after surgery for the majority of patients.
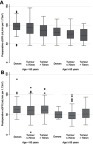
Table 1 Clinical characteristics of patients grouped by indication/tumor size, and age
Table 2 Associations between patient and tumor characteristics, and chronic kidney disease (CKD) upstaging in 944 patients who underwent radical nephrectomy for kidney tumors, considering the interaction between tumor size and patient characteristics
Figure 3 Forest plot showing odds of chronic kidney disease upstaging in patients grouped by tumor size/indication. (A) Forest plot showing associations between patients grouped by indication/tumor size and age, with adjustment made only for potential confounders (sex and Charlson comorbidity index). (B) The same model as (A), with adjustment also made for preoperative estimated glomerular filtration rate (eGFR). The estimates remain relatively similar for all groups, except large tumors, where the effect size reverses following adjustment for eGFR. Postoperative kidney function was recorded at approximately 12 months after surgery for the majority of patients.
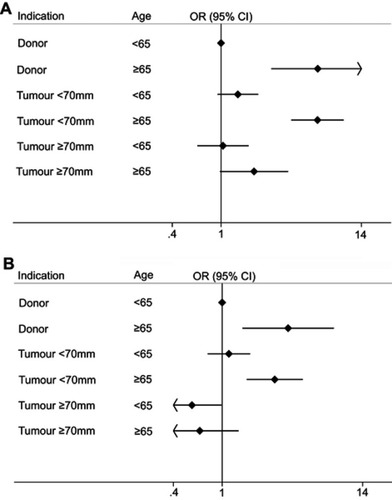
Table 3 Comparisons of postoperative kidney function between donor and tumor nephrectomy, grouped by age and tumor size
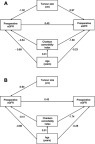
Figure 4 Potential role of collider-stratification bias. This directed acyclic graph (DAG) depicts the hypothesized causal relationship between preoperative estimated glomerular filtration rate (eGFR) and postoperative eGFR, confounded by both tumor size and other risk factors for chronic kidney disease (CKD). In this model, the relationship between tumor size and postoperative eGFR is shown to be mediated by preoperative eGFR, as larger tumors tend to cause preoperative reductions in kidney function. Physiologically, it would be expected that the direct effect of tumor size on postoperative eGFR is quite small in magnitude, because once a tumor has been excised, it should not continue to influence kidney function. Also depicted in this model are other risk factors for CKD, most of which were unmeasured, which would cause reductions in both pre- and postoperative eGFR. Unlike tumor size, other risk factors for CKD will probably lead to ongoing deterioration in kidney function. Therefore, preoperative eGFR becomes a collider in this DAG. When evaluating the association between tumor size and postoperative eGFR, adjusting for this collider may result in a biased estimate, because a spurious causal pathway is opened (Tumor Size → Preoperative eGFR ← CKD Risk Factors → Postoperative eGFR). This becomes a problem because an artificial comparison is generated. The existence of a low preoperative eGFR can be caused by a large tumor, CKD risk factors, or both; however, if a patient has a low preoperative eGFR caused by a growing tumor, it becomes less likely that the preoperative eGFR is caused by CKD risk factors. This is not taken into account by the model, which assumes a low preoperative eGFR has the same likelihood of causing low postoperative eGFR, regardless of the underlying reason (because the CKD risk factors are largely unmeasured, and not accounted for in the model). Consequently, patients with low preoperative eGFR caused by something that is unlikely to be associated with ongoing functional deterioration (a large tumor) are compared with patients who have a low preoperative eGFR caused by something that is likely to be associated with ongoing functional deterioration (CKD risk factors). This results in larger tumors being inappropriately seen as protective.
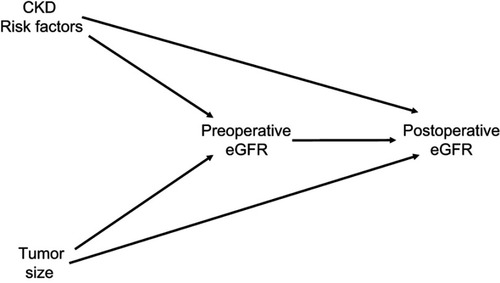
Table S1 Clinical characteristics of nephrectomy patients grouped by indication
Table S2 Application of exclusion criteria between patients grouped by age and tumor size in 1,981 patients diagnosed with RCCa
Table S3 Association between tumor size and postoperative kidney function, stratified by age
Table S4 Comparisons of postoperative kidney function patients grouped by age and tumor size with narrowed exclusion criteria
Table S5 Direct, indirect and total effects of various exposures on pre- and postoperative eGFR