
Figures & data
Figure 1 Venn diagram showing the sources of identification of 7,113 CP cases within the English dataset (1979–2014).
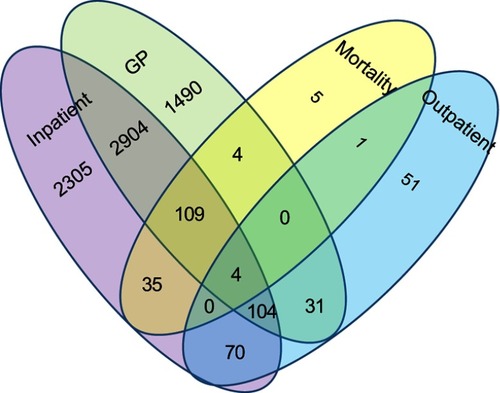
Figure 2 Venn diagram showing the sources of identification of 5,218 CP cases within the Welsh dataset (1979–2014).
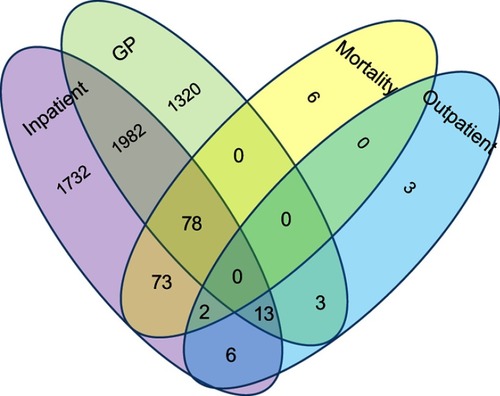
Table 1 Percentage of each 4-character code used for the total ICD-10 G80.0–83.3 codes applied to National Health Service contacts in inpatients, outpatients, and mortality data for England and Wales (2004–2014)
Table 2 Frequency and percentage usage of 3-character ICD-10 codes (or equivalent Read v2 code) per individual CYP with CP in primary and secondary care data
Table 3 Cerebral palsy/other paralytic syndromes (G80.0–G83.3) period prevalence per 1,000 population at risk for 2004–2014 by sex and social deprivation (quintiles of English indices of deprivation 2010 and Welsh index of multiple deprivation [IMD] 2011) within England and Wales. CIs in brackets. NB sex and IMD denominators do not equal the total number of cases in the two datasets due to missing data
Table S1 ICD 10 and corresponding Read v2 codes for cerebral palsy diagnosis