
Figures & data
Figure 1 Number of reported cardiac arrests and reporting hospitals per year. The figure illustrates the number of reported cardiac arrests (blue circles, left y-axis) and the number of hospitals reporting at least one cardiac arrest per year (red squares, right y-axis). Only cardiac arrests with a clinical indication for cardiopulmonary resuscitation are included. In 2017, two hospitals were involved in the registry but had no in-hospital cardiac arrest.
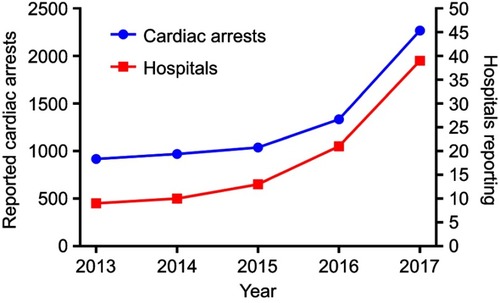
Table 1 Data collected
Table 2 Quality indicators in DANARRESTa